. 2023 Nov 8;81(10):891–897. doi: 10.1055/s-0043-1776411
The Author(s). This is an open access article published by Thieme under the terms of the Creative Commons Attribution 4.0 International License, permitting copying and reproduction so long as the original work is given appropriate credit (
https://creativecommons.org/licenses/by/4.0/
)
This is an open-access article distributed under the terms of the Creative Commons Attribution License, which permits unrestricted use, distribution, and reproduction in any medium, provided the original work is properly cited.
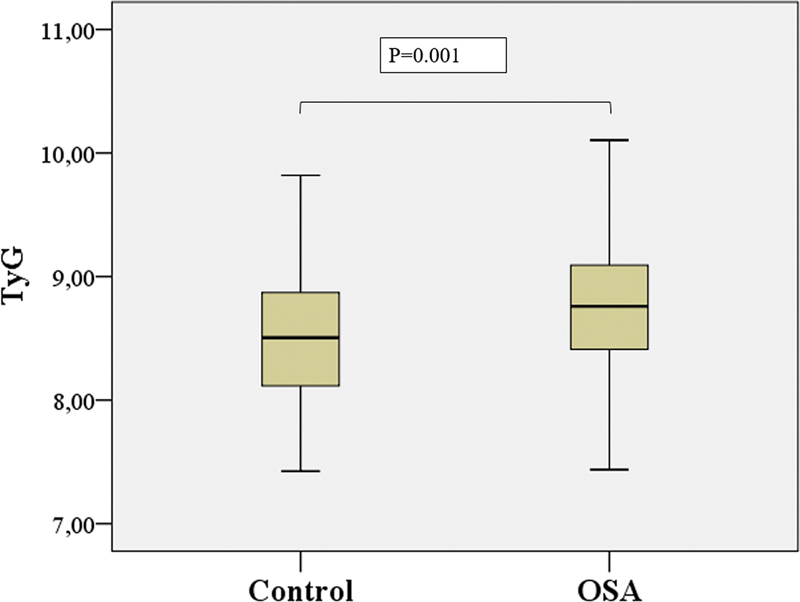
Figure 2.

Comparison of TyG values of patients with and without diagnosis of OSA by plot graph.
