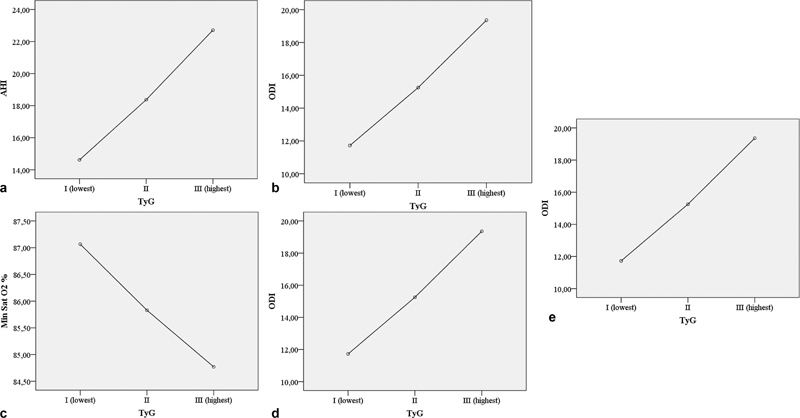
Figure 5.

(a) Means plot graphs of ODI; (b) Means plot graphs of AHI (c) Means plot graphs of the minimum Sat O2 (d) Means plot graphs of TST %90. time in minutes determined according to TyG index tertiles (p: 0.001; p:0.001; p:0.001; p:0.003) (e) Optimal TyG index cut-off value for predicting OSA.
