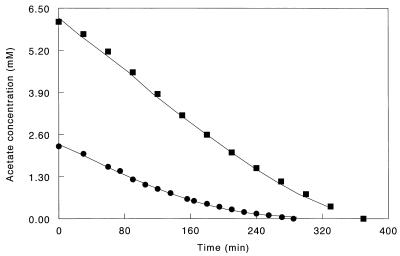
FIG. 1.
Acetate depletion curve for a concentrated suspension of D. amnigenus cells (▪) and D. acetoxidans cells (•). The markers represent the measured acetate concentrations, while the solid lines are best-fit curves calculated from estimates of Km, Vmax, and the initial acetate concentration (S0) via nonlinear regression analysis.

