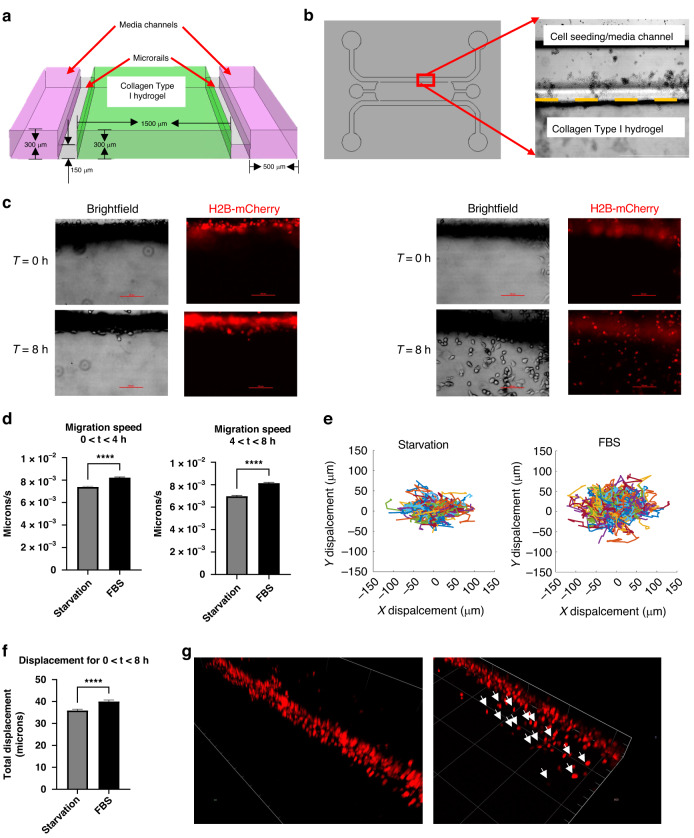
Fig. 5. Rail-based microfluidic invasion assay.
a Cross section of microchannels. Cells are seeded in collagen gel channel (green) which is separated from media channels (pink) by a narrow rail (gray) that constrains the collagen gel. b Gel-media interface seeded with MDA-MB-231 cancer cells. Dashed line indicates interface. c Representative images of MDA-MB-231 cancer cells (red) stimulated with starvation (no FBS, left) or FBS-containing full media (right) after 8 h. d Quantification of migration speed of single cells. Statistical analysis performed using Student’s t test. e Trajectories for starvation and FBS-containing conditions where each line represents the path of a single cell. f Quantification of cancer cell displacement after 8 h. Statistical analysis performed using Student’s t test. g Confocal imaging of invading cancer cells in starvation (left) or FBS-containing full media (right) conditions. White arrows indicate invading cancer cells. Data is representative of at least two independent biological replicates. Error bars denote SEM. *p < 0.05, ****p < 0.0001

