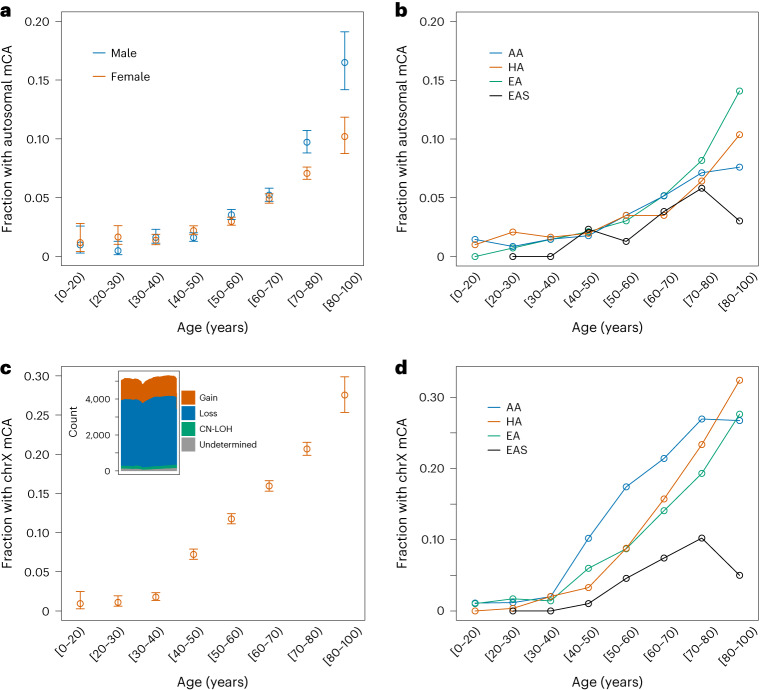
Fig. 2. Rate of mCAs by age.
a, Fraction of females (n = 41,895 biologically independent individuals) and males (n = 25,495 biologically independent individuals) with one or more autosomal mCA across age bins. Error bars represent 95% confidence intervals. b, Fraction of individuals across different genetic ancestry groups with one or more autosomal mCA across age bins. c, Fraction of females (n = 41,895 biologically independent individuals) with a chrX mCA across age bins. Error bars represent 95% confidence intervals. The inset shows a histogram of chrX mCA calls. The X axis shows 1 Mb windows across chrX, and the Y axis is the number of mCA calls that span the genomic window. d, Fraction of females across different genetic ancestry groups with a chrX mCA across age bins.

