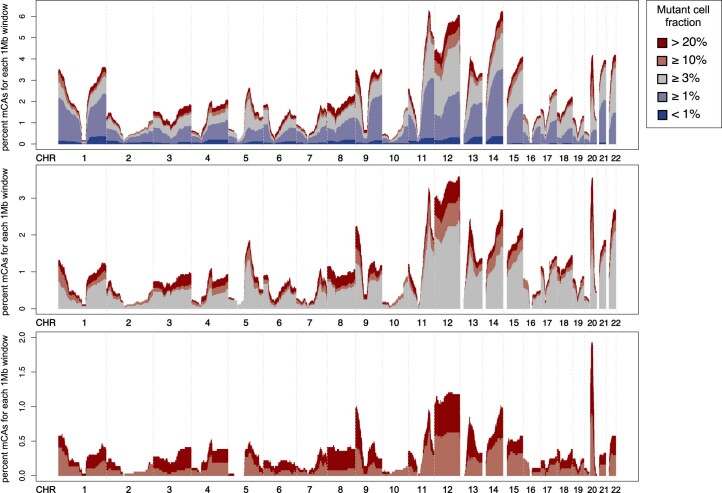
Extended Data Fig. 2. Genomic distribution of mosaic chromosomal alterations (mCAs) across mutant cell fraction (CF) categories.
The percent of mCAs (number of mCA calls spanning genomic location / all mCA calls) is shown on the vertical axis and genomic location is shown on the horizontal axis. Bins span 1megabase (Mb) and mCAs with CF>20% are in dark red, CF10% in light red, CF3% in grey, CF1% in light blue, and CF<1% in dark blue. CHR; chromosome.

