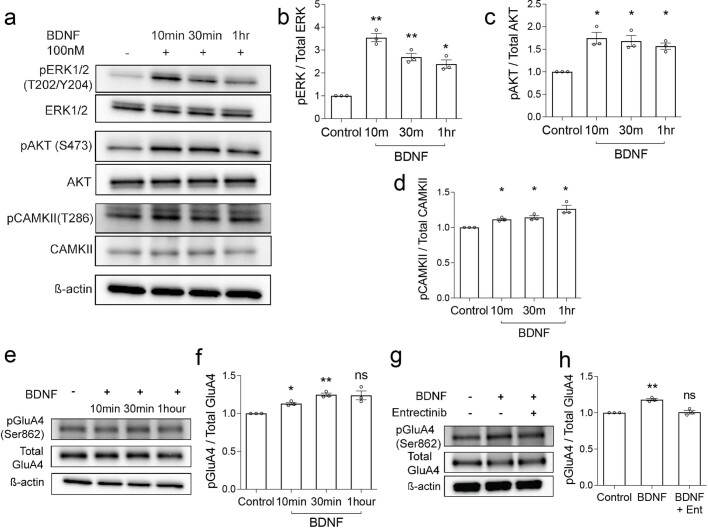
Extended Data Fig. 8. BDNF exposure induces PI3K, MAPK and CAMKII activation and AMPAR phosphorylation in pediatric glioma.
a, Western blot of proteins from SU-DIPG-VI cells treated with BDNF recombinant protein (100 nM) over a time course and probed for the indicated antibodies to demonstrate activation of downstream signaling pathways in comparison to untreated cells (vehicle only). b, Quantification of MAPK pathway activation in a, as the ratio of the normalized phospho-ERK (T202/Y204) levels to corresponding total protein levels for BDNF treated (100 nM) cultures compared to control (y-axis is in arbitrary units, n = 3 independent biological replicates, pERK Control vs 10 m P = 0.0048, Control vs 30 m P = 0.0094, Control vs 1 h P = 0.0167). c, Quantification of PI3K pathway activation in a, by comparing the ratio of the normalized phospho-AKT (S473) to corresponding total protein levels for BDNF treated (100 nM) cultures compared to control (y-axis is in arbitrary units, n = 3 independent biological replicates, pAKT Control vs 10 m P = 0.0293, Control vs 30 m P = 0.0307, Control vs 1 h P = 0.0148). d, Quantification of calcium pathway activation in a, by comparing the ratio of the normalized phospho-CAMKII (T286) to corresponding total protein levels for BDNF treated (100 nM) compared to control (y axis is in arbitrary units, n = 3 independent biological replicates, pCAMKII Control vs 10 m P = 0.0197, Control vs 30 m P = 0.0310, Control vs 1 h P = 0.0374). e, Representative Western blot analysis of primary patient-derived glioma culture, SU-DIPG-VI, treated with 100 nM BDNF at several timepoints using indicated antibodies. f, Quantification of the phospho-immunoblots ratio to corresponding total protein levels and normalized to vehicle treated control (y axis is in arbitrary units, n = 3 independent biological replicates, pGluA4 Control vs 10 m P = 0.0174, Control vs 30 m P = 0.0072), 8 h (pGluA4 Control vs BDNF P = 0.078). g, Representative Western blot analysis of 100 nM BDNF treated glioma cells (as in e,) at 30 min with and without entrectinib treatment (Ent, 5 µM). h, quantification of phospho-immunoblots (y axis is in arbitrary units, n = 3 independent biological replicates). Data are mean ± s.e.m. *P < 0.05, **P < 0.01, ns = not significant. Two-tailed one Sample t test for b, c, d, f, h.

