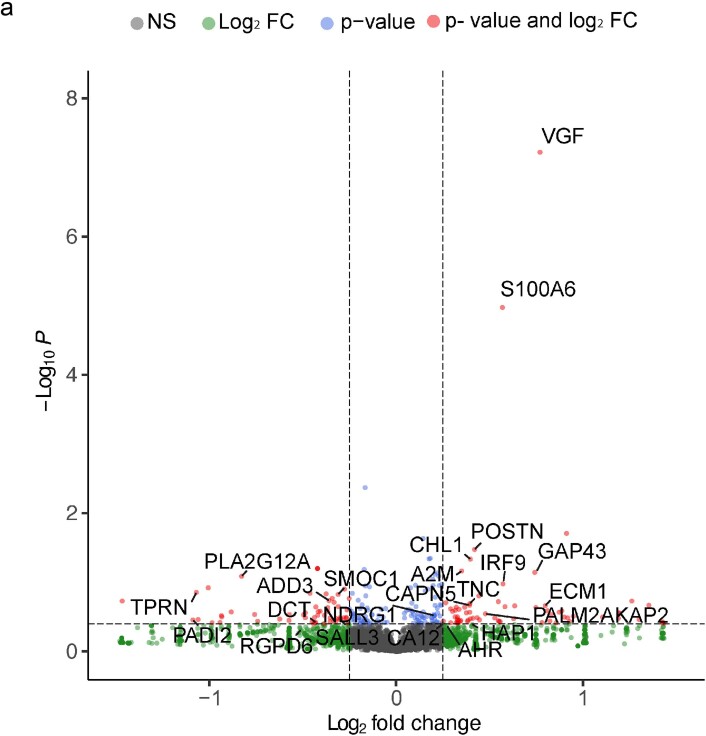
Extended Data Fig. 9. Gene expression changes induced in pediatric glioma upon BDNF exposure.
a, Volcano plot demonstrating gene expression changes in SU-DIPG-VI after 16 h of treatment in vitro with and without BDNF recombinant protein (100 nM). The x axis demonstrates the log2 fold change in gene expression (of BDNF-treated compared to vehicle-treated SU-DIPG-VI samples) and the y axis demonstrates Log10P significance (log10-transformed two-tailed p value significance, as calculated by the Wald test) of the gene expression change following analysis with DESeq2 in R.

