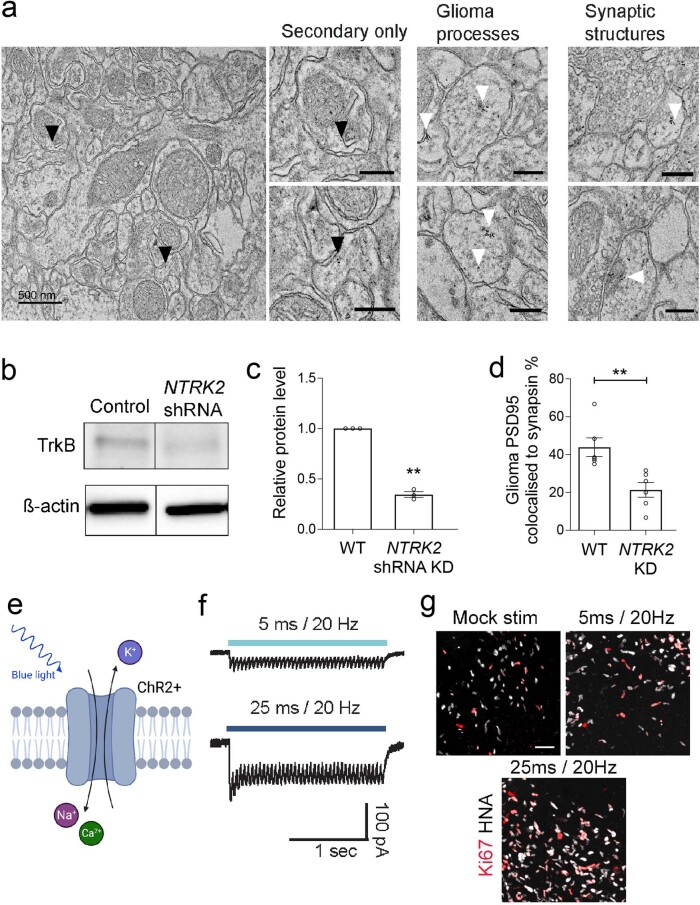
Extended Data Fig. 10. NTRK2 knockdown reduces colocalisation of neuron-to-glioma synaptic puncta, and optogenetic modeling of glioma membrane depolarization.
a, Electron microscopy images of glioma xenografted mouse hippocampal tissue sections with immuno-gold particle labeling of GFP. Left, secondary only stains to show background levels of non-specific gold particle labeling (black arrows). Right, examples of glioma processes and additional examples of neuron-to-glioma synapses positive for >4 immuno-gold particles (white arrows) in patient-derived SU-DIPG-VI cells xenografted to the hippocampus. Scale bar = 500 nm (left), all other scale bars = 200 nm. b, Representative western blot analysis of TrkB protein levels in control scramble shRNA and NTRK2 shRNA knockdown (KD) cultures (SU-DIPG-VI), using indicated antibodies. c, Quantification of western blot analysis with levels of TrkB normalized to total protein loading using ß-actin levels and compared to wild-type, Cas9-scramble control, cultures (y axis is in arbitrary units, n = 3 technical replicates, P < 0.0001). d, Quantification of the colocalization of postsynaptic glioma-derived PSD95-RFP with neuronal presynaptic synapsin in co-cultures of wild-type (n = 6 cells, 3 coverslips, P = 0.0050), or NTRK2 KD glioma cells (SU-DIPG-VI, n = 6 cells, 3 coverslips); replicates experiment in Fig. 4f, g using shRNA knockdown. e, The cation channel, Channelrhodopsin-2, is gated by blue light, inducing membrane depolarization of the cell. f, Electrophysiological traces of patch-clamped glioma cells stimulated with 470 nm light at 20 Hz, 1.0 mW/mm2 for 2 s (blue lines) at either 5 ms (light blue) or 25 ms (dark blue) light-pulse width. Note the difference in current amplitude elicited by 5 ms vs 25 ms light-pulse widths. g, Representative images of xenografted ChR2+ glioma cells quantified in 4k after mock stimulation, or optogenetic stimulation at 5 ms and 25 ms light-pulse width, gray denotes HNA-positive glioma cells; red denotes Ki67. Scale bar = 50 µm. Data are mean ± s.e.m. **P < 0.01. Two-tailed one sample t-test for c and two-tailed unpaired Student’s t-test for d.

