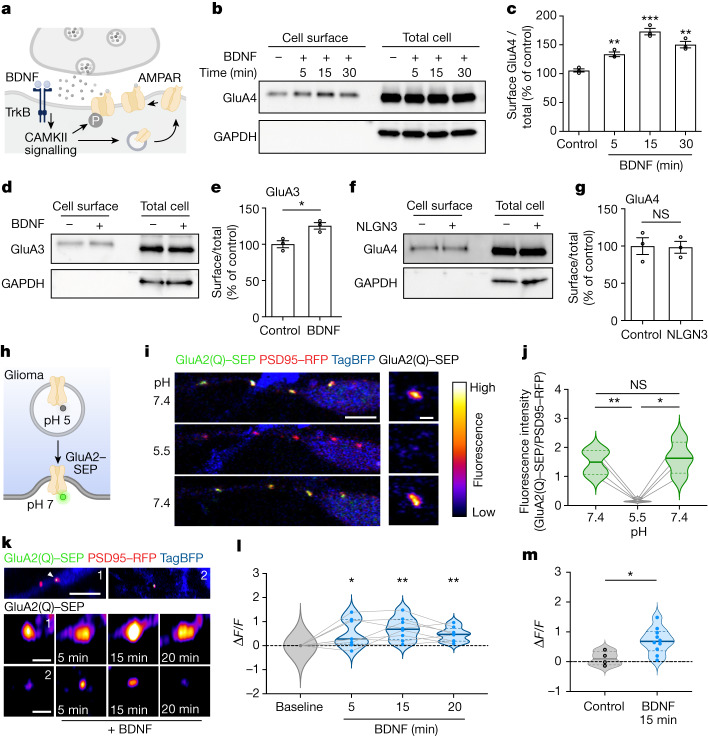
Fig. 3. BDNF regulates trafficking of AMPAR to the glioma postsynaptic membrane.
a, Schematic depicting AMPAR trafficking downstream of BDNF–TrkB–CAMKII signalling46. b, Western blot analysis of cell surface and total cell protein levels of GluA4 in SU-DIPG-VI glioma with or without BDNF treatment for 5, 15 and 30 min. c, Quantification of cell surface GluA4 in b (n = 3 independent biological replicates). d, Western blot analysis of cell surface and total cell protein levels of GluA3 in SU-DIPG-VI glioma with or without BDNF treatment for 30 min. e, Quantification of cell surface GluA3 in d (n = 3 independent biological replicates). f, Western blot analysis of cell surface and total cell protein levels of GluA4 in SU-DIPG-VI cells treated with NLGN3 for 30 min. g, Quantification of cell surface GluA4 data in f (n = 3 independent biological replicates). h, Schematic showing GluA2–SEP experiments. i,j, Validation of pHluorin approach. i, Left, representative images of a glioma cell process expressing GluA2(Q)–SEP, PSD95–RFP and whole-cell TagBFP in co-culture with neurons. Right, representative GluA2(Q)–SEP puncta. Scale bars, 5 µm (left) and 1 µm (right). Cells were exposed to pH 7.4 followed by pH 5.5 and then pH 7.4. j, Quantification of fluorescence intensity of GluA2(Q)–SEP puncta before, during and after acidic exposure (n = 4 puncta from a representative cell). k, Top, representative images of two processes from glioma cells expressing GluA2(Q)–SEP, PSD95–RFP and TAG-BFP2 in co-culture with neurons (scale bar, 5 µm). Middle and bottom, representative images of GluA2(Q)–SEP puncta at 0, 5, 15 and 20 min of BDNF incubation (scale bar=1 µm). l, Fluorescence intensity of co-localized GluA2(Q)–SEP:PSD95–RFP puncta over time with BDNF treatment (n = 8 puncta, 6 cells). m, Fluorescence intensity of co-localized GluA2(Q)–SEP:PSD95–RFP puncta after 15 min versus basal fluorescence in control (vehicle, n = 4 puncta, 2 cells) or BDNF-treated cells (n = 8 puncta, 6 cells). Data are mean ± s.e.m. Two-tailed unpaired Student’s t-test (c,e,g,m); two-tailed paired Student’s t-test (j); two-tailed one-sample t-test (l).

