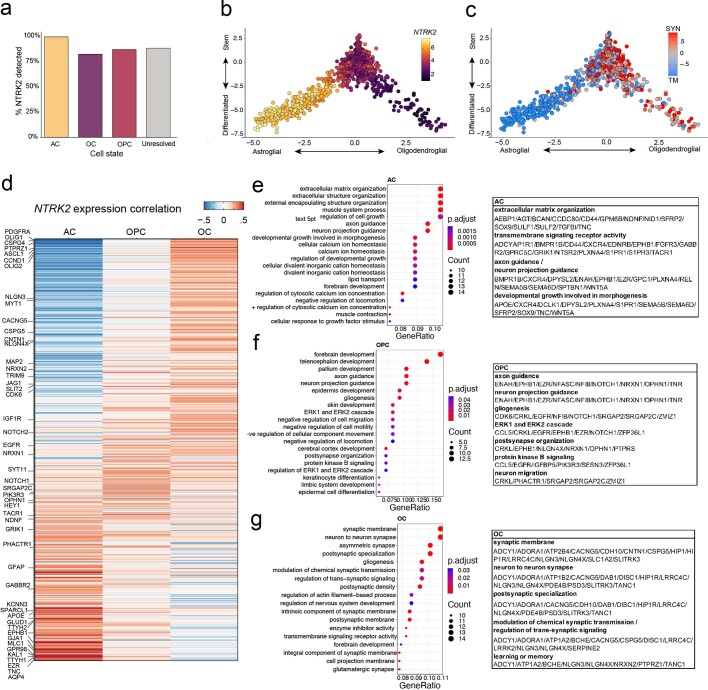
Extended Data Fig. 4. NTRK2 correlates with unique cellular mechanisms in distinct cell-state subgroups of pediatric DMG.
a, Analysis of previously published H3K27M+ DMG single-cell RNASeq data36 quantifying the percentage of tumor cells in which NTRK2 (TrkB) was captured in either the astrocyte-like (AC), oligodendrocyte-like (OC) and oligodendroglial precursor cell-like (OPC) glioma cells. b, NTRK2 expression level in malignant H3K27M+ malignant single cells projected on the glial-like cell lineage (x axis) and stemness (stem to differentiated; y axis) scores. NTRK2 expression level was smoothened (for the purpose of data visualization only) for each cell by assigning each cell with the average NTRK2 expression of its nearest neighbors in the Lineage vs. Stemness 2-dimensional space. c, Difference between the scores of the synaptic (SYN) and tumor microtube (TM) gene signatures (i.e. SYN – TM) in H3K27M+ malignant single cells projected on the lineage (x axis) and stemness (stem to differentiated; y axis) scores. d, Heatmap of genes correlating with NTRK2 expression in distinct cellular subgroups (astrocyte-like, oligodendroglial precursor cell-like, oligodendrocyte-like) of H3K27M+ malignant single cells. Genes were ordered according to the AC-OC score difference. e-g, Gene Ontology (GO) enrichment analysis for the top genes correlated with NTRK2 expression in distinct cellular subgroups within H3K27M+ diffuse midline glioma tumors (145, 138, 97 genes with Pearson’s correlation coefficient greater than 0.25 for the AC-like, OC-like and OPC-like malignant cell states respectively) (e, astrocyte-like; f, oligodendroglial precursor cell-like; g, oligodendrocyte-like). Right, tables depicting the genes associated with the biological processes identified (GO terms) for each cellular subgroup.

