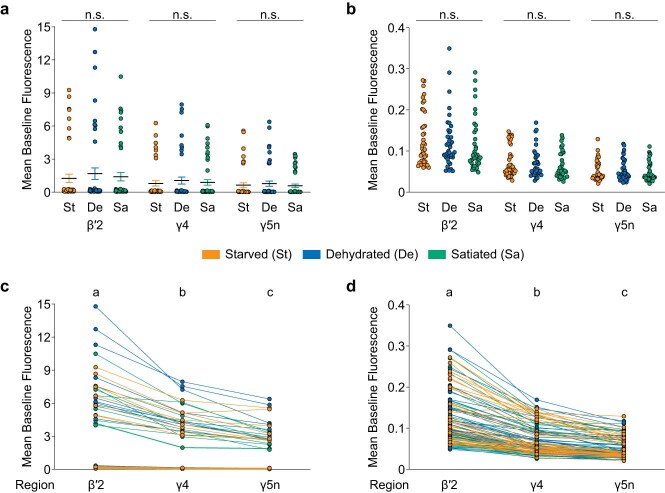
Extended Data Fig. 10. Manipulations of physiological state do not affect the baseline calcium signals of R48B04 DANs.
a, The mean baseline fluorescence (for the 60 s before stimulus presentation relative to the mean of a non-implicated region) of the initial-trial water and initial-trial sucrose samples in Fig. 6f for β′2, γ4, and γ5n DANs (n = 48 flies per state). All data mean ± SEM. b, Distribution of samples with mean baseline fluorescence below 0.4 (81.25% of all samples) for clarity. c, Each region has a different mean baseline fluorescence irrespective of physiological state (n = 144 flies in total from three states). Each data point from each region is connected to two data points corresponding to the other two regions of the same fly. d, Comparison across regions for 81.25% of samples with mean baseline fluorescence below 0.4 for clarity. Dots are individual data points that correspond to individual flies. All data points and connecting lines are coloured according to the physiological state of each fly (Starved: St, orange; Dehydrated: De, blue; or Satiated: Sa, green). No differences in mean baseline fluorescence are observed across physiological states in a, b (two-way ANOVA; main effect of state F(2,141) = 0.2188; p = 0.8038; n.s. = not significant). Different letters above groups in c, d indicate significantly different regions (p < 0.05; two-way repeated measures ANOVA then Tukey’s HSD; main effect of region F(2,282) = 29.23; p < 0.0001). Exact statistical values and comparisons in Supplementary Information.

