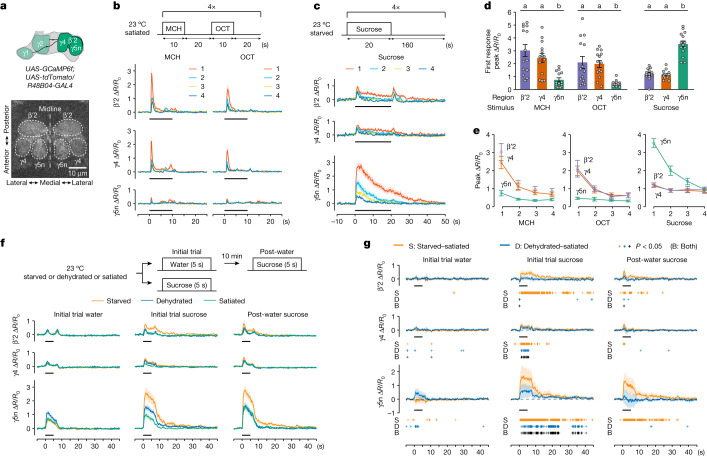
Fig. 6. Physiological state-dependent control of DAN responses.
a, Schematic (top) and two-photon imaging of regions of interest (ROI) (bottom) for DANs co-expressing GCaMP6f (displayed) and tdTomato. b, Top, odour presentation protocol. Bottom, calcium responses in β′2 (top), γ4 (middle) and γ5n DANs (bottom) to each MCH (left) and OCT (right) presentation. Black bars throughout indicate stimulus application. c, Top, sucrose presentation protocol. Bottom, DAN responses to each sucrose presentation. d, Peak heights of first DAN responses to MCH, OCT or sucrose. β′2 and γ4 DANs exhibit larger odour responses whereas γ5n DANs have larger sucrose responses. The break in the x axis demarcates separate experiments. Different letters above bars indicate significantly different regions (P < 0.05; two-way repeated measures ANOVA for each odour or one-way repeated measures ANOVA for sucrose then Tukey’s HSD). e, Only γ5n DAN peak responses diminish with repeated sucrose presentations. Data in d,e are mean ± s.e.m.; dots are individual data points that correspond to individual flies. f, Top, feeding protocol. Bottom, responses of β′2 (top), γ4 (middle) and γ5n DANs (bottom) to initial-trial water (left), initial-trial sucrose (middle) or post-water sucrose (right) in starved, dehydrated or satiated flies. g, Mean difference curves for responses in starved or dehydrated flies versus satiated flies. Crosses indicate significantly different recording frames (P < 0.05; two-sided unpaired t-test, not corrected for multiple comparisons). S, starved − satiated; D, dehydrated − satiated; B, common to S and D. Response curves show mean ± s.e.m. (b,c,f) or mean difference ± 95% confidence interval (g) for the normalized ratio of GCaMP6f to tdTomato signal (ΔR/R0); presentation numbers or physiological states are denoted by curve colour. n = 14 flies (b–e) and n = 24 flies (f,g). Exact statistical values and comparisons are presented in Supplementary Information.

