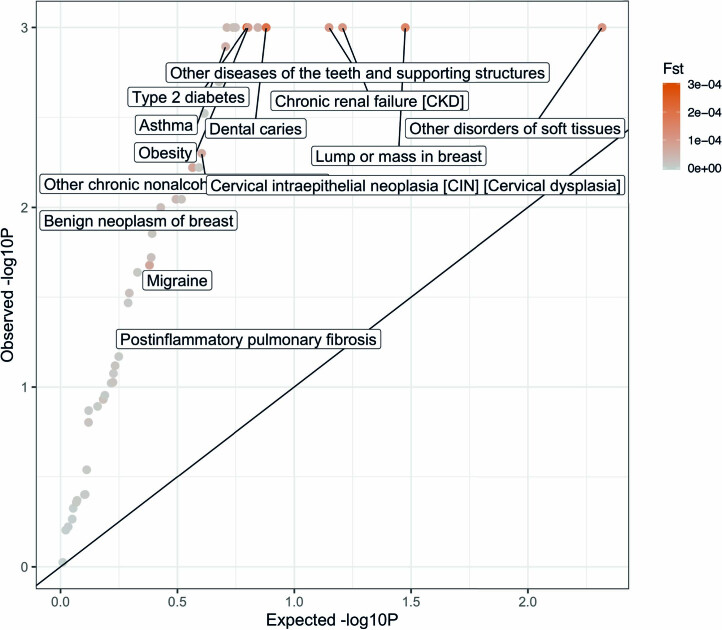
Extended Data Fig. 7. Excess FST of disease subtypes compared with controls with matched topic weights.
P-values are for testing case-FST significantly higher than control-FST of similar topic weight distribution. The permutation controls are sampled for 1,000 times with the same topic weights distribution and sample size to the disease subtypes. We focus on 49 of the 52 diseases that have more than one subgroup of at least 500 cases. Subtypes are defined based on the maximum value of the diagnosis-specific topic probability. Three diseases (‘hypertension’, ‘hypercholesterolemia’, and ‘arthropathy’) are excluded as there are not enough controls that match the topic weights of cases. The color shows the value of FST across subtypes. Exact P-values are reported in Supplementary Table 16.

