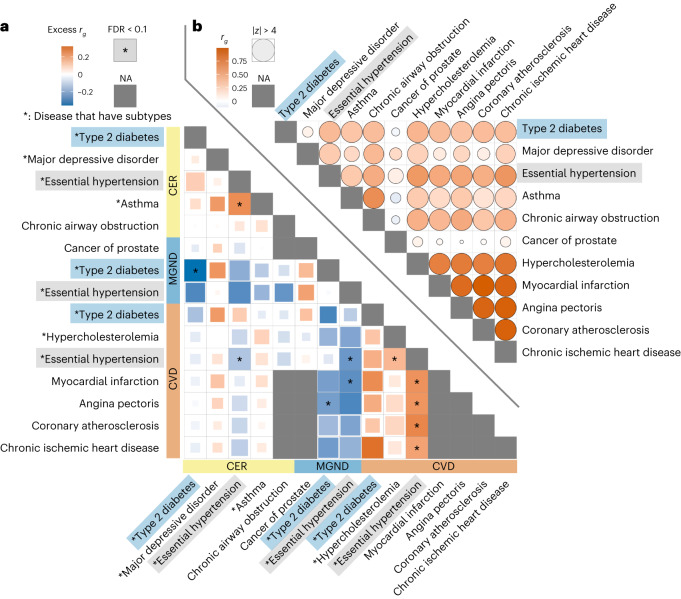
Fig. 7. Genetic correlations vary across disease subtypes defined by distinct topics.
a, Excess genetic correlations for pairs of 15 disease subtypes or diseases (nine disease subtypes (denoted with asterisks) + six diseases without subtypes), relative to genetic correlations between the underlying diseases. Full square with asterisk denotes FDR < 0.1; less than full squares have area proportional to z-scores for difference. Gray squares denote NA (pair of diseases without subtypes or pair of the same disease subtype or disease). b, Genetic correlations between the underlying diseases. Full circle denotes |z-score| > 4 for nonzero genetic correlation; less than full circles have area proportional to |z-score|. Numerical results are reported in Supplementary Table 14.

