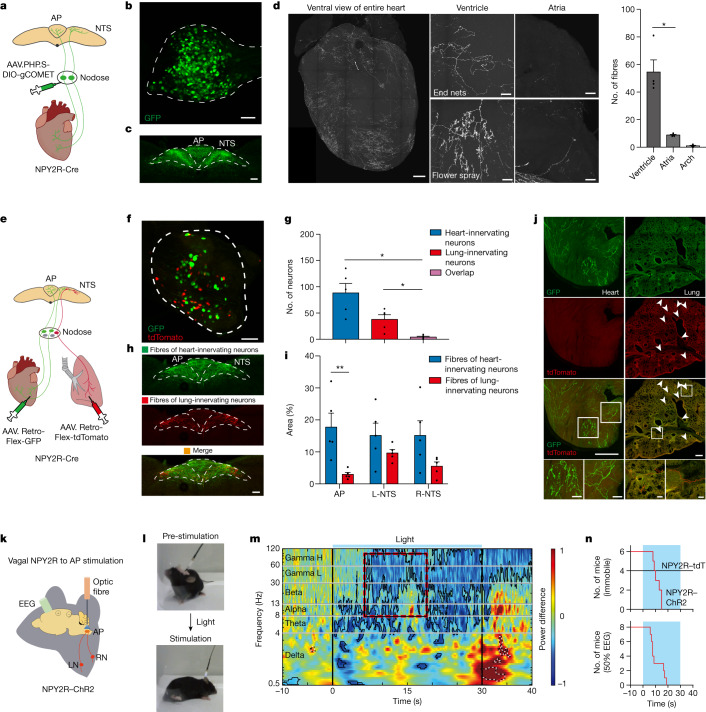
Fig. 1. Brainstem stimulation of NPY2R VSNs induces syncope.
a, Schematic of anterograde tracing of NPY2R VSNs. b, gCOMET-labelled neurons in a nodose ganglion of a NPY2R-Cre mouse (n = 4). c, Fibre distribution of NPY2R VSNs (green) in the AP and NTS (n = 4). d, Left, HYBRiD-cleared heart showing NPY2R VSN terminals in the heart ventricles and atria. Right, quantification of fibre distribution (n = 4, P = 0.0108). e, Schematic of retrograde tracing of NPY2R VSNs from heart and lung. f, Retrogradely labelled VSNs from the heart (green) and lung (red, n = 5). g, Quantification of overlap (n = 5, heart/overlap P = 0.0198; lung/overlap P = 0.0254). h,i, Spatial projection pattern of heart-innervating (green) and lung-innervating (red) NPY2R VSNs (h) and quantifications (i, n = 5, P = 0.0079). R, right; L, left. j, NPY2R VSN terminals in retro-labelled heart and lung. Arrowheads indicate lung terminals. (n = 5). k, Schematic of optogenetic stimulation of NPY2R VSN terminals in the AP with EEG preparation. l, Photostimulation (20 Hz) of freely moving mice causes them to fall over and become immobile. m, Power is plotted using wavelets on EEG recordings and normalized to baseline. Mean power during light-off trials was subtracted from light-on trials. Areas of significant drops in power (blue with black border) or increases (red with dashed black/white border) are indicated. Strong decreases (50%) in power were observed (red box, width indicates range of latencies), which indicated syncope (n = 12 sessions from 8 mice). H, high; L, low. n, Top, step plot showing latency to first bout of immobility in NPY2R–ChR2 mice (n = 6) and control NPY2R–tdTomato (tdT) mice (n = 4). Bottom, step plot showing latency to 50% power drop (n = 8). *P < 0.05, **P < 0.01 by two-way repeated measures analysis of variance (ANOVA) with Šidák multiple comparisons or repeated measures ANOVA Geisser–Greenhouse correction with Tukey multiple comparisons. All error bars show mean ± s.e.m. Scale bars, 100 μm (b,c,d (ventricle and atria), f,h,j (bottom four)) or 500 μm (d (whole heart), j (top six)).

