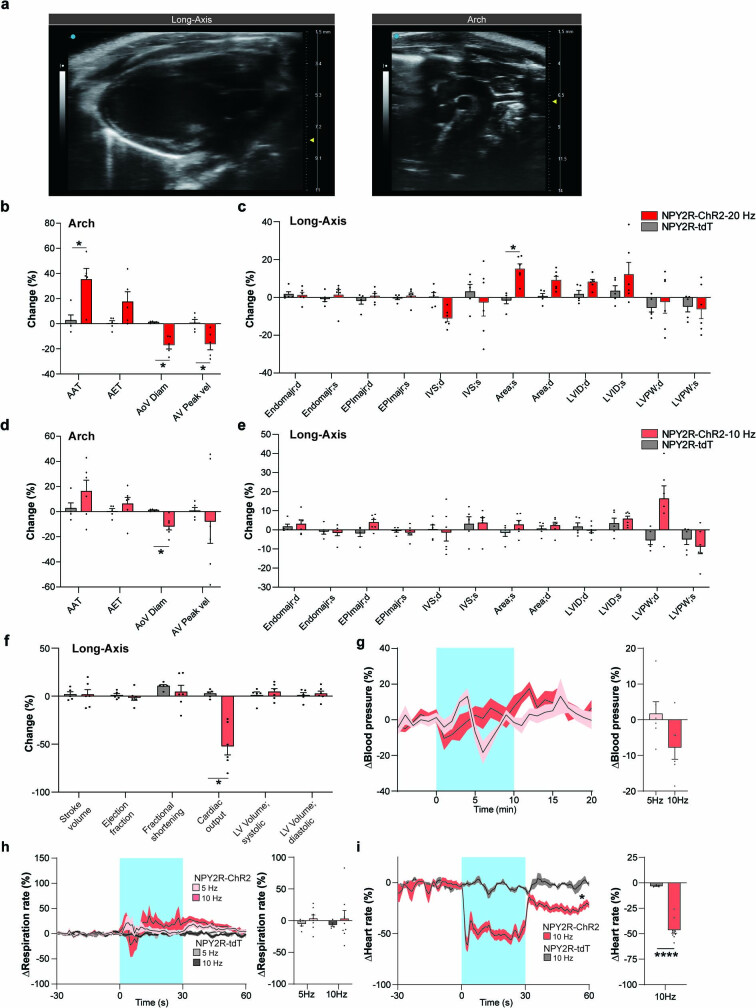
Extended Data Fig. 5. Physiological characterization of vagal NPY2R to area postrema (AP) photostimulation.
a, Representative ultrasound images of left ventricle (long-axis view) and aortic arch. b, 20 Hz photostimulation induced changes in the arch. After stimulation, the ascending aorta diameter decreased (AoV Diam, p = 0.0197). Aortic blood flow was also measured using a color Doppler function. Peak blood velocity in the ascending aorta (AV Peak vel, p = 0.0499) dropped. Aortic acceleration time (AAT, p = 0.0499) showed an increase induced by stimulation, indicating longer latency to reach peak velocity in the ascending aorta (right, n = 5). c, 20 Hz photostimulation induced changes in the left ventricle. After stimulation left ventricle end-systolic area increased significantly (Area;s, p = 0.0108), but no obvious change was observed in other parameters (left, n = 6 for ChR2, n = 5 for tdTomato). d, 10 Hz photostimulation induced changes in the aortic arch. After 10 Hz stimulation, only AoV Diam decreased (n = 6 for ChR2, n = 5 for tdTomato, p = 0.0346). e-f, 10 Hz photostimulation induced changes in the left ventricle. No obvious change was observed except for decreased cardiac output (n = 6 for ChR2, n = 5 for tdTomato, NPY2R/tdT mice with 20 Hz stimulation from Fig. 2d were reused as control, p = 0.0101). g, Blood-pressure during 5 Hz and 10 Hz photostimulation did not change compared to baseline (n = 6). h, Respiration-rates during 5 Hz and 10 Hz light stimulation showed no changes (n = 8 for ChR2, n = 5 for tdTomato). i, Heart-rate with 10 Hz stimulation during freely moving conditions showed sustained reduction during (left, p = 0.0353) and after laser delivery (n = 9 for ChR2, n = 5 for tdTomato, p < 0.0001). p < 0.05*, p < 0.0001**** by two-tailed unpaired t-tests with Holm-Šidák multiple comparisons or two-way ANOVA with Šidák multiple comparisons. All error bars and shaded areas show mean ± s.e.m.

