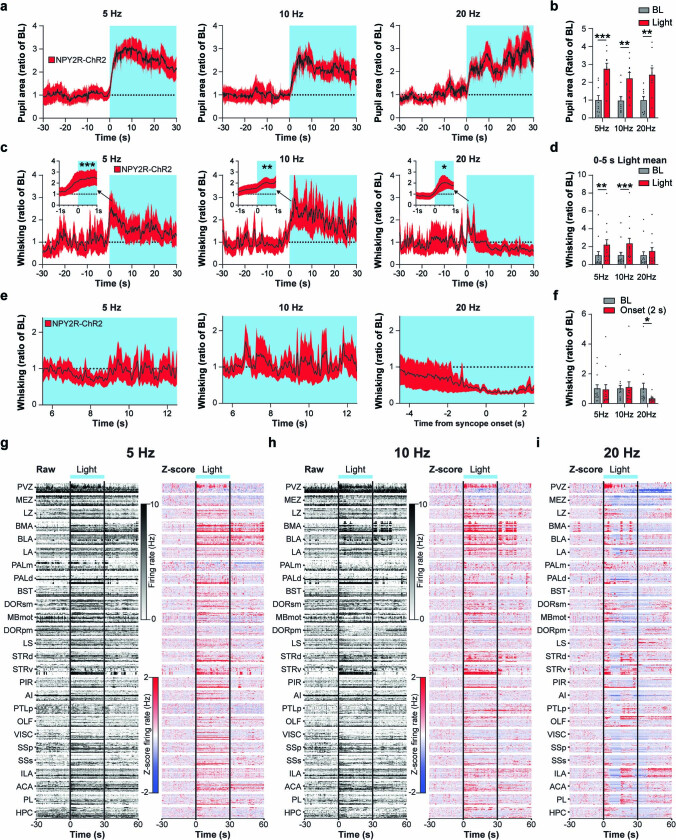
Extended Data Fig. 7. Facial dynamics and Neuropixels data visualization during vagal NPY2R to area postrema (AP) stimulation.
a, Pupil area was tracked during photostimulation and averaged across sessions. b, Pupil area was significantly increased from baseline during photostimulation (n = 9 sessions from 5 mice, 5 Hz p = 0.0002, 10 Hz p = 0.0067, 20 Hz p = 0.0018). c, Max whisking values were collected in a 0-1 s time window after laser onset (insets) and averaged. These values were compared to normalized baseline whisking. Under all stimulation frequencies, mice quickly began whisking. d, Average whisking behavior increased during a 5 s window after laser onset at 5 and 10 Hz, but not the syncope inducing 20 Hz (n = 13 sessions from 7 mice, 5 Hz p = 0.0024, 10 Hz p = 0.0007). e, Aligning whisking behavior to syncope onset showed decrease of movement at 20 Hz (right) which was not observed at lower frequencies f, Quantification of whisking 2 s after syncope onset (n = 13 sessions from 7 mice, 20 Hz, p = 0.0254), and between 10–12 s after laser onset. g-h, Raw firing rates (left) and baseline z-scored firing rates (right) from all recordings across all animals at 5 Hz and 10 Hz stimulation in 100 ms time bins. i, Baseline z-scored firing rates from all recordings at 20 Hz stimulation in 100 ms time bins. Note the disruption of ongoing activity in most regions shortly after light onset under the 20 Hz condition as compared to 5 or 10 Hz: an average change of −0.17 in z-scored firing rate. p < 0.05*, p < 0.01**, p < 0.001*** by repeated measures two-way ANOVA with Šidák multiple comparisons. All error bars and shaded areas show mean ± s.e.m.

