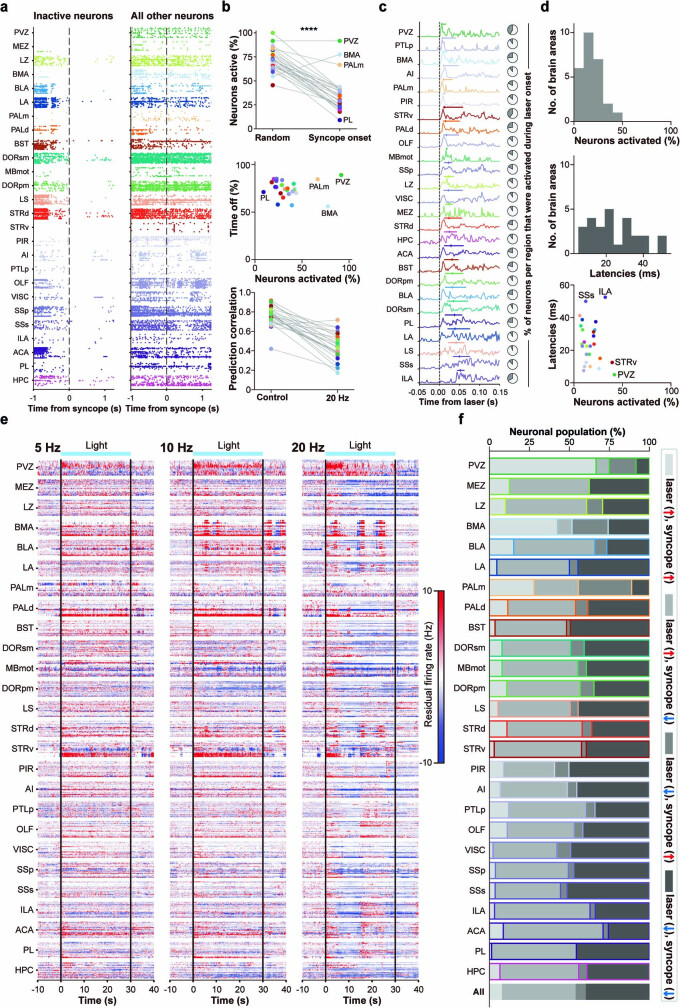
Extended Data Fig. 8. Regionwise neuronal activity after vagal NPY2R to area postrema (AP) stimulation controlling for spontaneous movements.
a, Spike rasters of neurons aligned to syncope onset (as defined by 50% LFP drop) and divided into groups of neurons that became inactive vs all other neurons. b, Quantification of neural activity during syncope. The percentage of active neurons dropped dramatically during syncope compared to a random time period (top, p < 0.0001). Scatter plot for individual brain regions (middle). Correlation between the prediction and raw data across all timepoints per area, in the control segment and the 20 Hz laser segment, in time bins of 1 s (bottom). c, Quantification of laser-activated neurons in each region. Activity traces of neurons at laser onset are normalized to individual maximum firing rate and averaged. Horizontal lines above each trace denote 25–75% quartiles, and the tick along the line is the median value by which regions have been sorted in ascending order (shortest to longest latency). Pie charts indicate the proportion of recorded cells in each region that were activated in response to laser onset (right, gray shaded area). d, Quantification of brain-wide neuronal activation in response to laser onset. All regions are activated within 60 ms of laser onset (bottom). e, Residual firing rates at 5, 10, and 20 Hz photostimulation in 100 ms bins. f, Region-wise residuals from 20 Hz laser stimulation separated into 4 response property categories. “laser” and “syncope” labels indicate the time window of response (laser and syncope onset, respectively), the “(↑)” and “(↓)” indicates the direction of change in the residual i.e. ( ↑ ) means the behavioral model was under-predicting neuronal firing, ( ↓ ) means overprediction. Most brain regions are dominated by neurons that include “syncope (↓)”. This indicated that the behavioral prediction model was mostly unable to predict reductions in neural activity during syncope. p < 0.001*** by two-tailed paired t-test.

