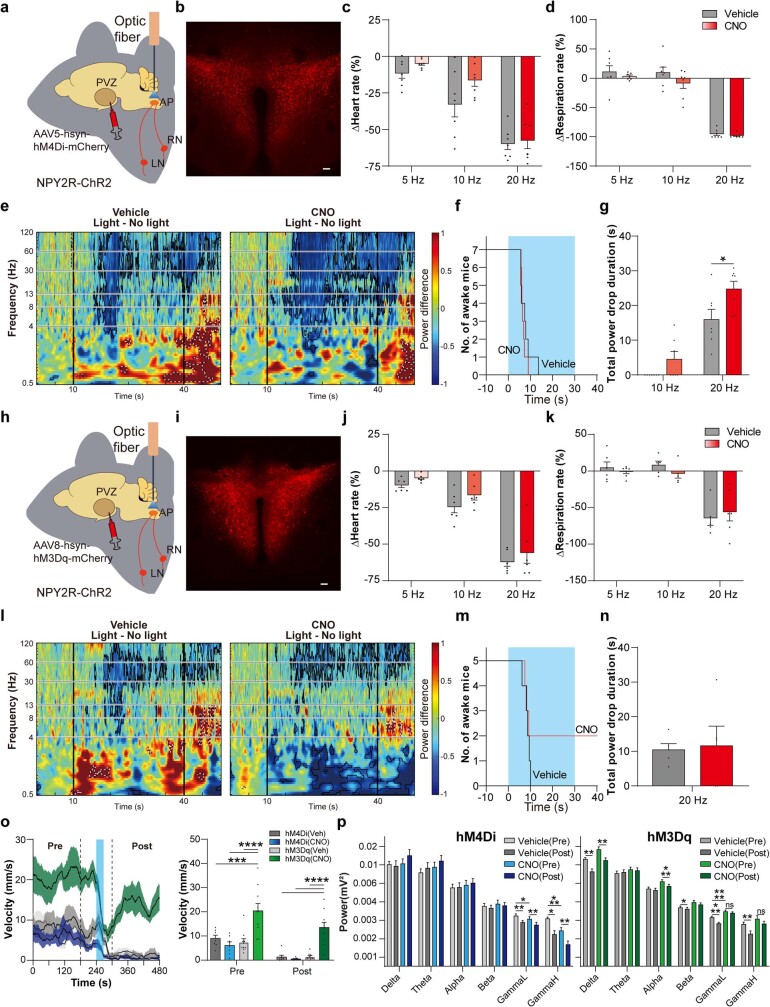
Extended Data Fig. 9. Bidirectional manipulation of the hypothalamic periventricular zone (PVZ) modifies syncope expression and states of arousal.
a, Illustration of vNAS with PVZ chemogenetic inhibition experiments. b, Representative image of hM4Di-mCherry expression in PVZ area. c-d, PVZ inhibition induced by CNO injection did not change the heart-rate reduction (c) or respiration-rate reduction (d) caused by photostimulation (n = 7). e, Subtraction plots showing replication of syncope triggered changes in EEG power under vehicle (left, n = 9 for no light, n = 7 for light) and an expanded area of power reduction under PVZ inhibition with CNO (right, n = 7). f, Step plot showing latency to first bout of immobility in CNO (red line, n = 7) and Vehicle (black line, n = 7) group with 20 Hz photostimulation (blue area). g, Total duration of EEG power drop was increased when the PVZ was inhibited during 20 Hz photostimulation (n = 7, p = 0.0449). At 10 Hz under CNO, >50% power drops were observed in 3 out of 7 mice, while that threshold was not reached under Vehicle. h, Illustration of vNAS with PVZ chemogenetic activation experiments. i, Representative image of hM3Dq-mCherry expression in PVZ area. j-k, PVZ excitation induced by CNO injection did not change the heart-rate reduction (j) or respiration-rate reduction (k) caused by photostimulation (n = 6). l, Subtraction plots showing replication of syncope triggered changes in power under vehicle (left) and unchanged power difference in the gamma range, but a decrease in delta (1–4 Hz) under CNO triggered PVZ activation (right, n = 10 sessions across 5 mice). m, Step plot showing latency to first bout of immobility in CNO (red line) and Vehicle (black line) group with 20 Hz photostimulation (blue area, n = 5). Note that 2 of the 5 mice did not faint under the CNO condition, suggesting a suppression of vNAS triggered syncope. n, Total duration of 50% power drop was unchanged between Vehicle and CNO conditions (n = 5). o, Average plots showing locomotor activity 4 min before 20 Hz stimulation (pre) and after (post) with PVZ chemogenetic manipulation under CNO. Mice with hM3Dq expression in the PVZ (green) showed dramatic increases in baseline locomotor activity (pre, hM4Di(Veh) p = 0.0001, hM4Di(CNO) & hM3Dq(Veh) p < 0.0001) under CNO and continued to move around the arena after recovering from 20 Hz induced syncope (post, hM4Di(Veh), hM4Di(CNO) & hM3Dq(Veh) p < 0.0001, n = 10 sessions from 5 mice for hM3dq, n = 7 sessions from 7 mice for hM4Di). p, Average fast-fourier transform (FFT) of EEG recording before and after 20 Hz photostimulation with PVZ chemogenetic manipulation under CNO. In hM4Di mice (left, blue n = 7) pairwise pre/post comparisons reveal significant drops in the gamma range after stimulation (GammaL(Veh) p = 0.0072, GammaH(Veh) p = 0.0101, GammaL(CNO) p = 0.0018, GammaH(CNO) p = 0.0012), indicating potential sustained reduction in arousal state, which is also reflected in their locomotor activity. In addition, CNO compared to Vehicle dropped gamma power even before 20 Hz stimulus was delivered (GammaL(pre) p = 0.0128, GammaH(pre) p = 0.0004). In hM3Dq mice (right, green, n = 10 session across 5 mice) pairwise pre/post comparisons reveal significant drops in delta (Vehicle p = 0.0019, CNO p = 0.0034) and alpha power (CNO p = 0.0006), and interestingly, no observable drops in the gamma range under CNO (GammaL(pre/post) p = 0.2377, GammaH(pre/post) p = 0.1449). Taken together, 20 Hz photostimulation may cause a sustained reduction in arousal state, while ongoing PVZ activation (CNO) causes an increase in baseline (pre) arousal state (GammaL p < 0.0001) which is maintained even after 20 Hz photostimulation. p < 0.05*, p < 0.01**, p < 0.001***, p < 0.0001**** by paired two-tailed t-tests, paired two-tailed t-tests with Holm-Šidák multiple comparisons, two-way repeated measures ANOVA with Šidák multiple comparisons or two-way repeated measures ANOVA with Holm-Šidák multiple comparisons. Scale bars, 100μm. All error bars and shaded areas show mean ± s.e.m.

