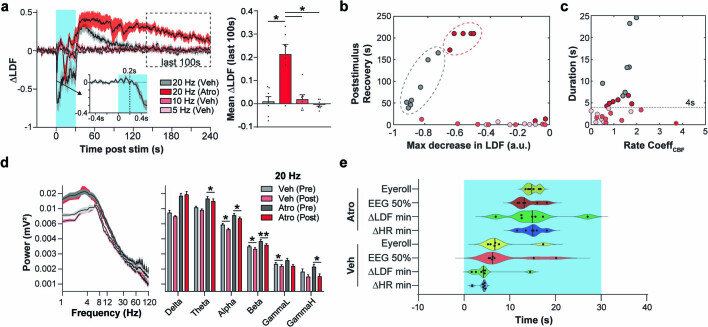
Extended Data Fig. 11. Atropine augments sustained changes in cerebral blood flow (CBF) and delays other metrics in response to vNAS.
a, Extended time window of LDF measured CBF (Fig. 4j) with vNAS (left). Atropine caused a sustained higher CBF for minutes following 20 Hz photostimulation. A ‘late recovery phase’ is marked as dashed box during last 100 s. Inset depicts at least 200 ms delay in changes in CBF following laser onset. Average CBF measurements during the last 100 s remained higher under atropine compared to all other conditions (right, n = 7, 20 Hz(Veh) p = 0.0444, 10 Hz(Veh) p = 0.0283, 5 Hz(Veh) p = 0.0219). b, Scatter plot of the time CBF takes to recover to baseline post vNAS, compared to the CBF minima during 30 s vNAS. Note that CBF under the atropine condition in 4 out of 7 mice, did not return to baseline during the recording window. c, Scatter plot of the duration of time spent below 50% of the baseline CBF compared to the rate coefficient, (i.e., rate of CBF decrease/rate of CBF increase, which captures the shape of CBF change across time, a higher rate coefficient indicates a rapid decrease followed by a slower increase) during vNAS stimulation. The dashed line on the scatter plot marks a line (4 s duration CBF drop) that segregates fainters vs non-fainters. d, Mean fast-fourier transform (FFT) of EEG recording before and after 20 Hz vNAS (left). Atropine caused a general increase in power (three-way ANOVA, main effect of Atropine, p < 0.0002). Pairwise pre/post comparisons reveal drops in the beta-gamma range after stimulation (Beta(Veh) p = 0.0424. Beta(Atro) p = 0.0065, GammaL(Veh) p = 0.0327, GammaH(Atro) p = 0.0209), indicating potential sustained reduction in arousal state under head-fixed conditions (right, n = 7). e, Violin plot depicting the time-course of recorded events during 20 Hz vNAS. Note that atropine causes a delay in observed sequence of events (HR, LDF, EEG, and eye-roll, n = 6 for all except n = 7 for LDF min and EEG 50% vehicle). p < 0.05*, p < 0.01** by two-tailed paired t-tests with Holm-Šidák multiple comparisons or repeated measures ANOVA with Holm-Šidák multiple comparisons. All error bars and shaded areas show mean ± s.e.m.

