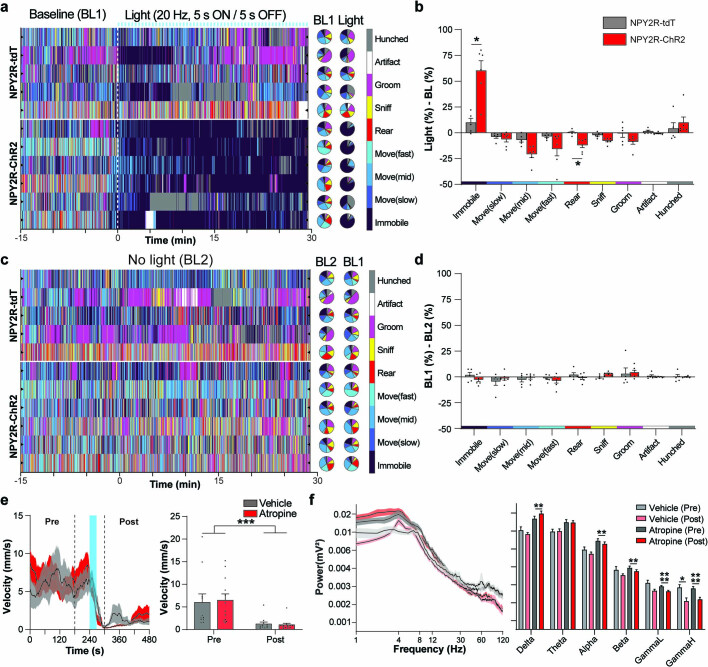
Extended Data Fig. 12. Behavioral and state changes caused by vNAS.
a, Color-coded ethogram using the MoSeq pipeline (1 mouse per row). Photostimulation promotes immobility. To the right of the ethogram, pie charts show the proportion of time individual mice spent engaged in each behavior during baseline (BL1) and photostimulation (Light) periods. b, Quantification of the % change in behavior during light and baseline conditions. Photostimulation significantly increased immobility (n = 6 for ChR2, n = 5 for tdTomato, p = 0.0155) and decreased rearing (p = 0.0254). c, Moseq data shown is the final day of habituation data one day prior to experimental photostimulation. On the right, pie charts show the proportion of time individual mice spent engaged in each behavior during the full habituation period the day before (BL2) and during the 15 min baseline period on the following photostimulation experimental day (BL1, a). d, Quantification of baseline behavior during habituation day (BL2) and experimental baseline day (BL1). Baseline behavior was the same across mice during both periods (n = 6 for ChR2, n = 5 for tdTomato). e, Average plots showing locomotor activity 4 min before 20 Hz stimulation (pre) and after (post) with either vehicle or atropine. In addition to acute syncope, brief 20 Hz vNAS for 30 s causes sustained reduction in mouse locomotion which is not altered by atropine (n = 12 sessions across 7 mice for atropine, n = 11 sessions across 7 mice for vehicle, two-way repeated measures ANOVA, main effect of pre/post, p = 0.0002). f, Fast-Fourier transform (FFT) of EEG recording before and after 20 Hz photostimulation. Average traces of FFT profile (left) show a general increase in power under atropine (n = 12 sessions across 7 mice, three-way ANOVA, main effect of Atropine, p = 0.0108, replicated in Extended Data Fig. 11d). Pairwise pre/post comparisons (right) reveal significant drops in the beta-gamma range after stimulation (Beta(Atro) p = 0.0015, GammaL(Atro) p < 0.0001, GammaH(Veh) p = 0.0301, GammaH(Atro) p < 0.0001), indicating potential sustained reduction in arousal state, which is also reflected in their locomotor activity. p < 0.05*, p < 0.01**, p < 0.001***, p < 0.0001**** by two-tailed paired or unpaired t-tests with Holm-Šidák multiple comparisons or two-way repeated measures ANOVA. All error bars and shaded areas show mean ± s.e.m.

