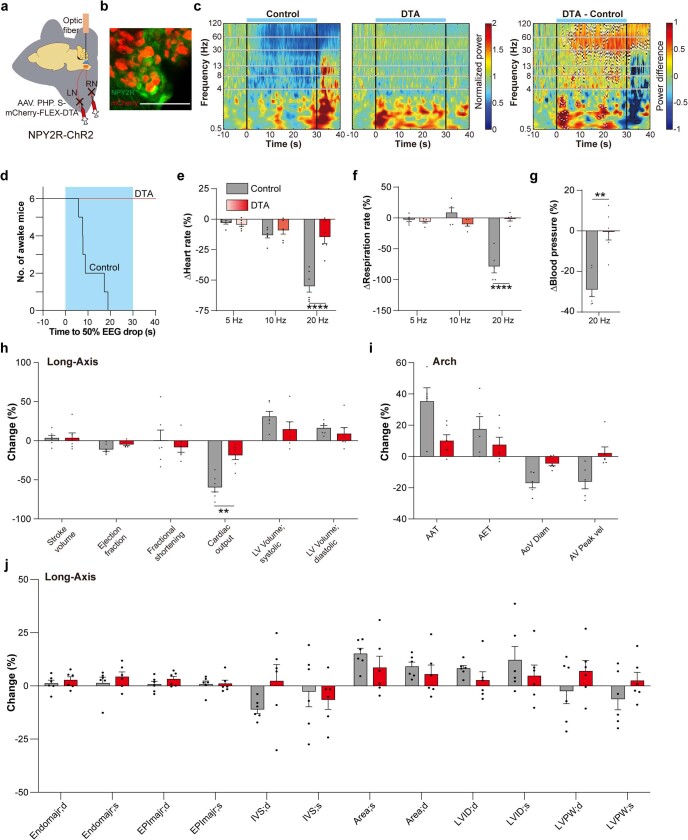
Extended Data Fig. 13. Ablation of NPY2R VSNs abolishes vNAS induced syncope and physiological changes.
a, Schematic of vNAS with diphtheria toxin subunit A (DTA) mediated ablation of NPY2R VSNs. b, Representative image of nodose ganglia injected with AAV-mCherry-FLEX-DTA virus and stained with NPY2R antibody (n = 13). Scale bar, 100 μm. c, Mice were tested for syncope and EEG power drops before DTA injection (left, n = 11 sessions across 7 mice). After DTA ablation of NPY2R VSNs, the same mice showed no appreciable drops in EEG power (middle, n = 12 sessions across 6 mice). Subtraction plots show significant differences in expected time x frequency ranges that are associated with syncope. d, Step plot showing latency to 50% mean power drop relative to baseline between 8–100 Hz with photostimulation (blue area). Notably, no mice reached the 50% power threshold after DTA ablation (n = 6). e, vNAS induced heart-rate reduction in control and DTA group. DTA mice showed less robust reduction compared to control group with 20 Hz stimulation (n = 6, p < 0.0001). f, vNAS induced respiration-rate changes in control and DTA group. During 20 Hz vNAS, respiration-rate reduction was markedly suppressed in DTA group (n = 5, p < 0.0001). g, Blood-pressure did not decrease with 20 Hz vNAS in DTA group (n = 6, p = 0.0019). h-j, Cardiac metrics of left ventricle (n = 6) and aortic arch (DTA n = 6, control n = 5) measured by ultrasound in DTA mice with 20 Hz vNAS. Reduction in cardiac output (p = 0.0043) was blocked. Changes in other parameters also showed a trend of being blunted compared to control group (control group data was reused from 20 Hz NPY2R/ChR2 mice Fig. 2d, Extended Data Fig. 5b, c). p < 0.01**, p < 0.0001**** by two-tailed paired or unpaired t-tests with Holm-Šidák multiple comparisons or two-way repeated measures ANOVA with Šidák multiple comparisons. All error bars show mean ± s.e.m.

