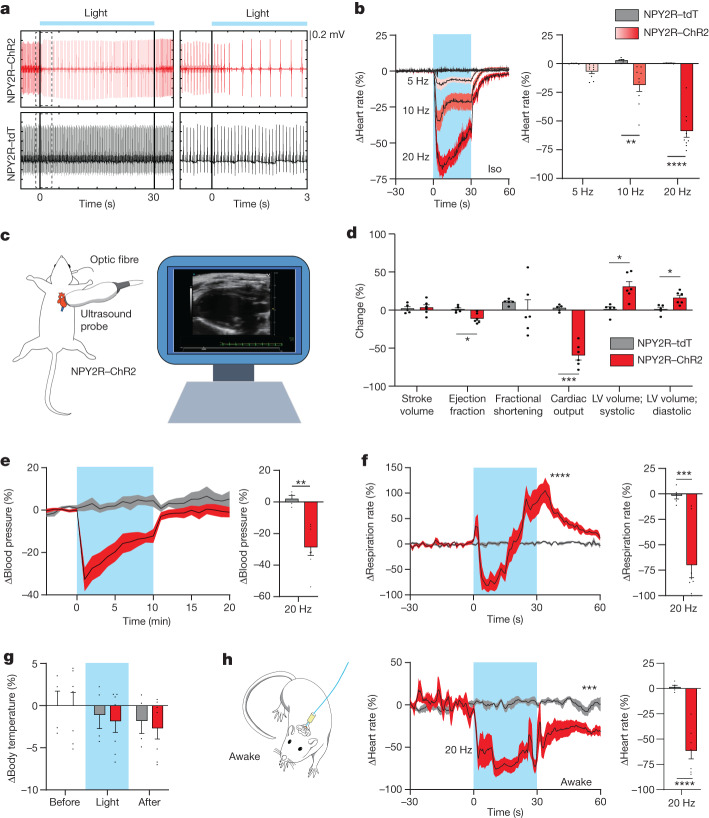
Fig. 2. vNAS suppresses cardiovascular function.
a, ECG waveforms recorded under 2% isoflurane. Photostimulation substantially lowered the heart rate. b, Average heart-rate traces with different stimulation frequencies (left) and quantification (right) under isoflurane (iso). Increasing photostimulation frequencies reduced heart rates in a scalable manner (n = 9 for ChR2 mice, n = 5 for tdTomato mice; 10 Hz, P = 0.0079; 20 Hz, P < 0.0001). c, Left, illustration of the opto-ultrasound strategy. During recording, the ultrasound probe was placed on the left chest with an implanted optic fibre above the AP. Right, an example of the parasternal long axis view display. d, Photostimulation induced changes in cardiovascular metrics. Both systolic and diastolic left ventricle (LV) volume increased, whereas cardiac output and ejection fraction decreased. Stroke volume and fractional shortening did not change (n = 6 for ChR2 mice, n = 5 for tdTomato mice; ejection fraction, P = 0.0282; cardiac output, P = 0.0005; volume; systolic, P = 0.0282; volume; diastolic, P = 0.0282). Colour key for mice is used for e–h. e, Left, blood pressure decreased with photostimulation in a time-locked manner. Right, quantification (n = 7 for ChR2 mice, n = 4 for tdTomato mice; P = 0.0029). f, Left, respiration was significantly suppressed followed by an increase with photostimulation (P < 0.0001). Right, quantification (n = 8 for ChR2 mice, n = 5 for tdTomato mice; P = 0.0001). g, No changes in internal body temperature were observed during photostimulation (n = 7 for ChR2 mice, n = 4 for tdTomato mice). h, Left, diagram depicting photostimulation and ECG recordings under freely moving conditions. Middle, photostimulation also significantly decreased the heart rate under awake conditions and remained suppressed after light delivery ended (P = 0.0001). Right, quantification (n = 7 for ChR2 mice, n = 5 for tdTomato mice, P < 0.0001). *P < 0.05, **P < 0.01, ***P < 0.001, ****P < 0.0001 by two-way ANOVA with Šidák multiple comparisons, two-tailed unpaired t-tests with Holm–Šidák multiple comparisons or two-tailed unpaired t-tests. All error bars and shaded areas show the mean ± s.e.m.

