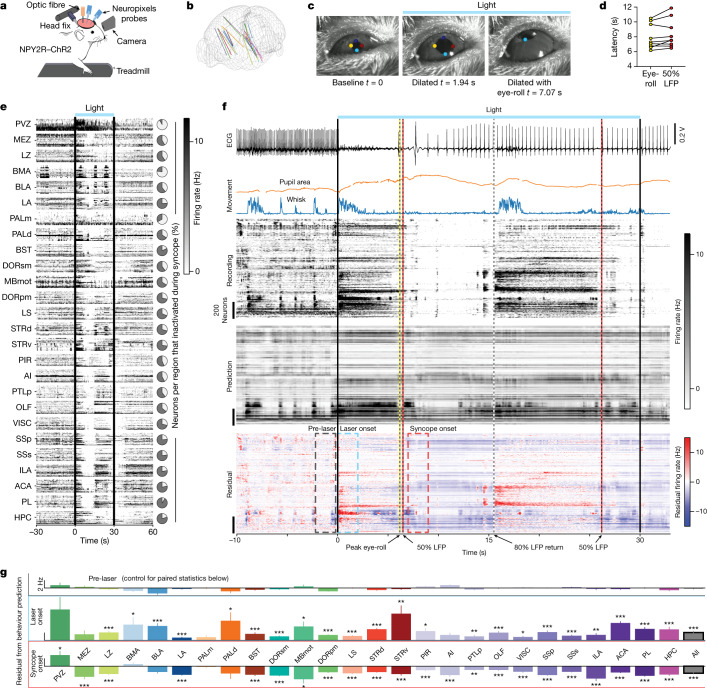
Fig. 3. vNAS-triggered syncope is associated with widespread suppression of brain activity.
a, Illustration of head-fixed Neuropixels experiments. Cameras were positioned to record pupil and facial movements. b, Neuropixels probe trajectories were registered using SHARPtrack51 and plotted. c, Time course of eye dynamics during optogenetically triggered syncope. The pupil rapidly dilates (middle) followed by a characteristic eye-roll during syncope (right, n = 9 sessions from 5 mice). d, Latency to eye-rolling behaviour and 50% LFP power drop are correlated (r = 0.9596, P < 0.0001). e, Firing rates of units from all probes and mice that exhibited syncope during 20 Hz photostimulation. Left, neuronal spiking rates in most regions of the brain substantially decreased during syncope. Right, pie charts show the percentage of neurons that were inactive (grey area). f, Example of a Neuropixels recording session during 20 Hz photostimulation. Top to bottom: (1) recording showing reduction in heart-rate (ECG); (2) pupil area and whisking behaviour (Movement); (3) raw firing rates across two probes (Recording); (4) predicted firing rates based on movement model (Prediction); (5) residuals after subtracting predicted firing rates from recorded firing rates (Residual). Relevant events during recording are noted below with arrows. Windows of analysis are shown with dashed colour-coded boxes. g, Quantification of changes in brain activity that are not predicted by movements (residuals). Averages of residual activity during the pre-laser time window (top, grey). Small deviations from 0 indicates good predictive capability of the facial movement model under baseline conditions. Residual firing rates increase after laser onset (middle, blue). Significant changes were determined by comparison to pre-laser. Syncope onset showed a widespread decrease in firing rate that was not predicted by the facial movement model, except for the PVZ, which still significantly increased during syncope (bottom, red). *P < 0.05, **P < 0.01, ***P < 0.001 by two-tailed paired t-tests. All error bars show the mean ± s.e.m. See Methods for definitions of the abbreviations used for brain regions.

