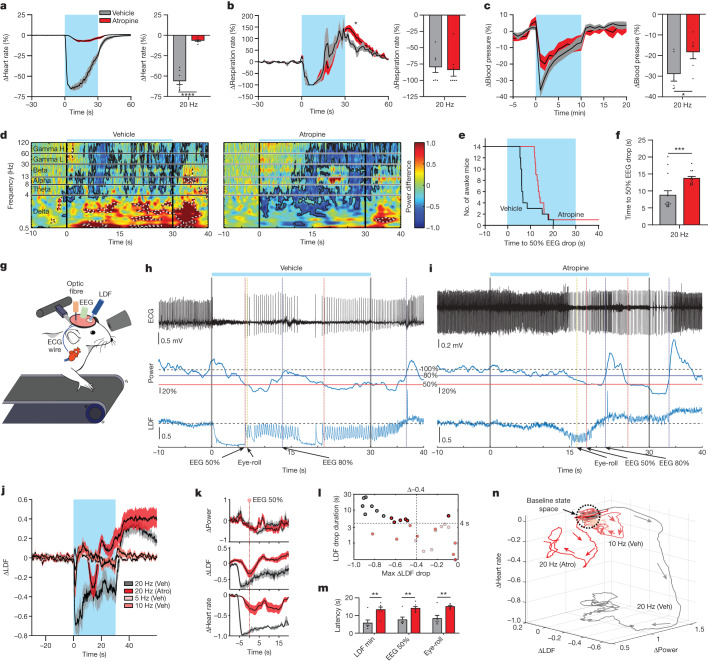
Fig. 4. Parasympathetic suppression delays syncope-related phenotypes, including substantial drops in CBF.
a, Left, average heart-rate traces with photostimulation under atropine (Atro) and vehicle (Veh) pretreatment. Right, atropine markedly suppressed heart-rate drops (n = 7, P < 0.0001). Colour key for mice is used for b–m. b, As for a, but for the respiration rate (n = 7, after stimulation, P = 0.0110; during stimulation, P = 0.9695), c, As for a, but for blood pressure. Atropine reduced drops in blood pressure (n = 6, P = 0.0191). d, Head-fixed mice showed EEG power drops when treated with vehicle (left). Treatment with atropine delayed the latency (right, n = 14 sessions from 14 mice). e, Step plot showing the delay in latency to power drop (n = 14 sessions from 14 mice). f, Quantification of e shows that atropine increases latencies (n = 14 sessions from 14 mice, P = 0.0002). g, Illustration of head-fixed experiments that recorded CBF using LDF, with ECG, EEG and pupil recording during vNAS. h,i, Example recordings from the same mouse treated with vehicle (h) and atropine (i). Top to bottom: (1) ECG; (2) average EEG power normalized to baseline (Power); (3) LDF signal normalized to baseline reflecting CBF changes (LDF). Specific event markers are noted with arrows. j, Average traces of LDF across all experimental conditions (n = 7). k, Averaged data aligned to latency to reach 50% power drop (n = 7). l, Scatter plot between the maximum LDF drop during stimulation compared with the duration it remained below 50% of the maximum drop (n = 7). m, Quantification of the latency increases caused by atropine (n = 6; LDF min, P = 0.0010; EEG 50%, P = 0.0041; eye-roll, P = 0.0027). n, Plot illustrating the group-averaged dynamics of heart rate, LDF and power, with arrows denoting the progression over time. All groups started in the same state space at the top. After stimulation, groups rapidly diverged while following the same general pattern, even though their magnitudes were different (n = 7). *P < 0.05, **P < 0.01, ***P < 0.001, ****P < 0.0001 by two-way repeated measures ANOVA with Šidák multiple comparisons or two-tailed paired t-tests. All error bars and shaded areas show the mean ± s.e.m.

