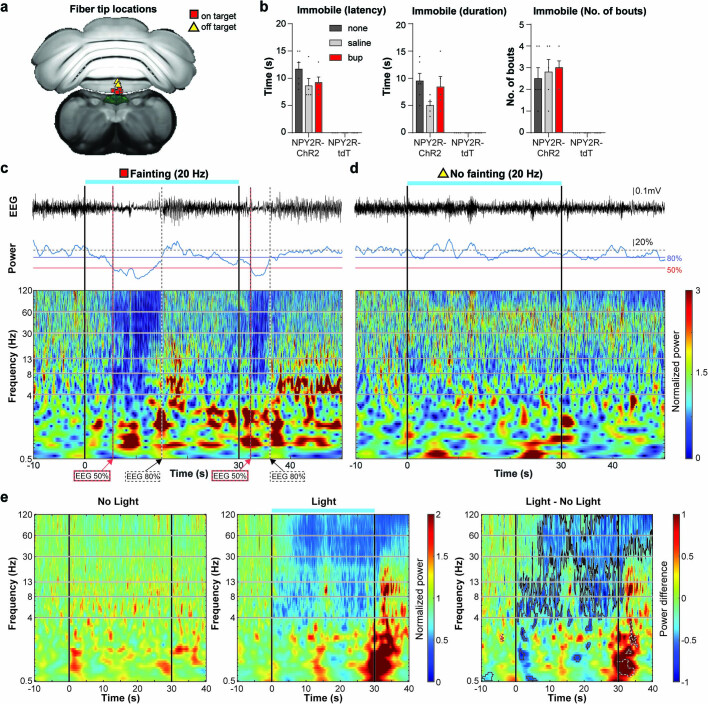
Extended Data Fig. 4. Syncope is associated with a drop in EEG power.
a, Postmortem optic fiber tip locations targeted above the area postrema (AP) labeled on the corresponding (−7.4 mm AP) Allen Mouse Brain Common Coordinate Framework (CCF)58. Off-target fiber implants (yellow triangles) did not evoke behavioral phenotypes with photostimulation. Proper fiber placement is indicated by red squares. b, Quantification of behavior from video assessment. Buprenorphine was administered prior to vagal NPY2R to AP photostimulation to rule out a pain response and controlled by saline or no injection. Latency to first immobility (left), duration (middle), and number of bouts (right, n = 5 except for none/ChR2 = 6, none/tdTomato = 4). c, Single trial EEG analysis with on-target vagal NPY2R to AP stimulation (20 Hz) during freely moving recording. Raw EEG trace from temporal cortex is shown on top, average power between 8–100 Hz is shown in the middle with 50% and 80% thresholds, and the Morse wavelet power transformation is shown below as a heatmap. The latency to when baseline normalized average power between 8–100 Hz dropped below 50% is indicated by dashed red/black lines, the latency to when average power returned to 80% is marked by dashed white/black lines. The period between is considered one “bout”. d, Single trial EEG analysis of a mouse with off-target fiber placement (yellow triangle in “a”). Note, the average power trace does not cross the 50% threshold. e, Photostimulation produced a delayed, but stark power drop in the alpha-gamma range. The subtraction plot on the right is the same as Fig. 1m. This drop in the alpha-gamma range can be used as biomarker for syncope (n = 12 sessions across 8 mice). All error bars show mean ± s.e.m.

