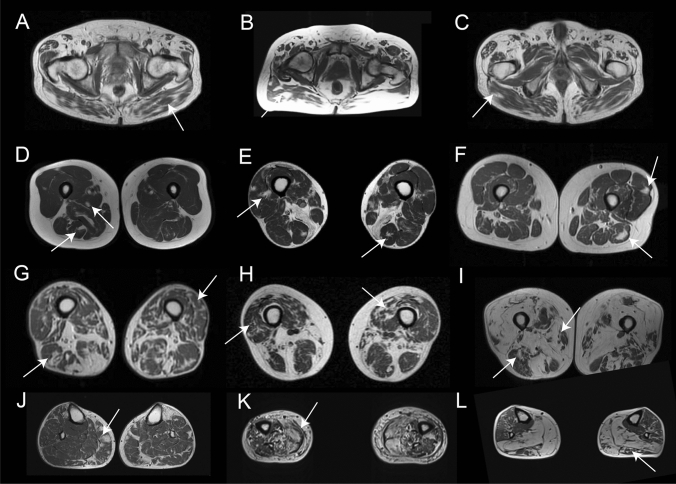
Fig. 1.
Distribution of fat replacement in the skeletal muscles of patients with mutations in the VCP gene. The figure shows examples of the distribution of fat replacement in patients with mutations in the VCP gene at different stages of disease progression. A, B and C show examples of fat replacement in the gluteus maximus. D, E and F show patients at early stages of disease progression where fat can be seen as spots of fat in the muscles as highlighted by the arrows. G, H and I show images of fat replacement in the thigh of patients at middle (G and H) and advanced (I) stages of disease progression. J, K and L show examples of the fat replacement in the muscles of the legs in patients in early (J) and middle (K and L) stages of disease progression

