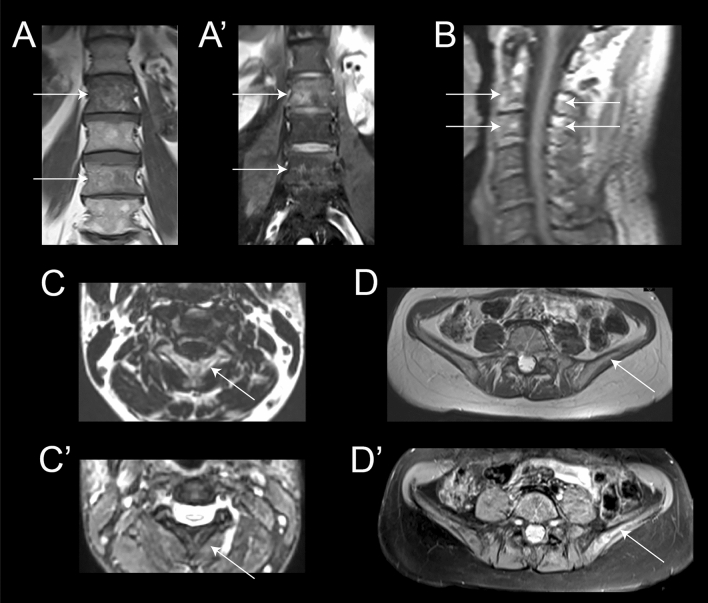
Fig. 8.
Examples of MRI finding in patients with Paget disease of the bone included in this study. Coronal views T1 (A) and T2 with fat saturation (A’)-weighted images of the lumbar spine showing heterogeneity of the signal of bone marrow at L2 and L4 levels compared to L1 and L3 (arrows). Coarsed trabeculae are more visible on T1 and edema of the vertebral body on T2 fat sat. Sagital (B) and axial (C and C’) T1-weighted and axial T2 with fat saturation views centered on the upper cervical spine. Signal heterogeneity, cortical thickening and bone enlargement of the entirety of C2 and C3 vertebrae is detectable (arrows). Axial T1 (D) and T2 (D’) with fat saturation-weighted images centered on the iliac crest. Bone changes are very subtle on T1 but bone edema and heterogeneity is more visible on T2 on the left side (arrow) especially in comparison with the right side

