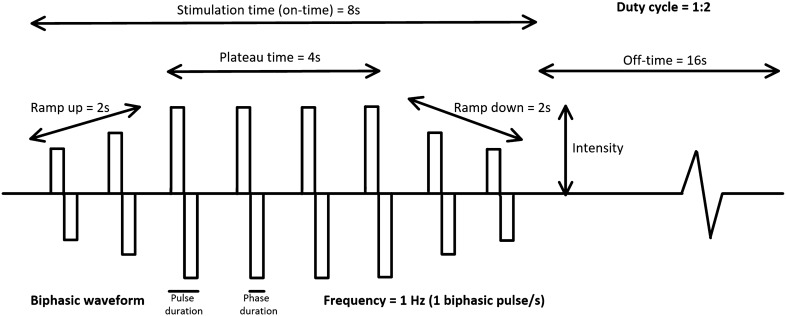
Fig. 2.
Settings of neuromuscular electrical stimulation (NMES). Schematic illustration of the characteristic of the stimulation during NMES. A biphasic wave pattern is illustrated in the figure, where each impulse includes a positive and negative pulse. The time of each of these are described as phase duration and the time of both the positive and negative pulses as pulse duration. The frequency describes the number of impulses per second. The stimulation time (on time) is the total time for the stimulation, and the ratio between the on- and off-time can be referred to as duty cycle (e.g., 1:3). The stimulation time consists of the plateau time which is the time the stimulation is at the highest stimulation intensity, and ramp-up and down time that represents the gradual increase respective decrease of stimulation intensity

