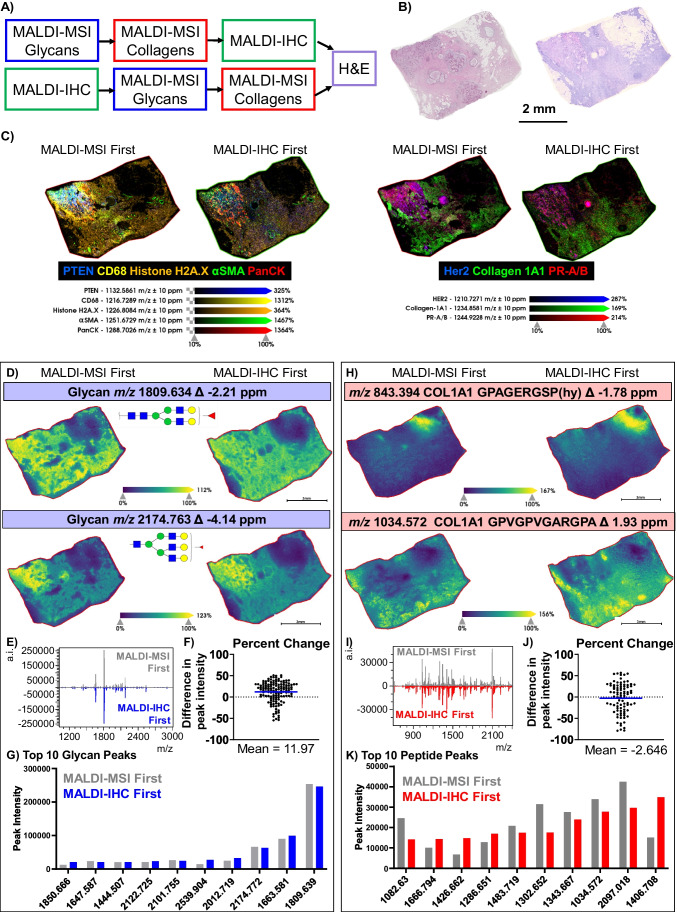
Fig. 1.
Combination of MALDI-MSI and MALDI-IHC on Human Breast Cancer Tissue. A An overview of the workflows performed. B Example H&E staining of two separate sections of the breast tissue; before workflow is started (left) and after workflows are completed (right). C Two sets of AmberGen MALDI-IHC images from slides processed by MALDI-MSI first (left tissue) and IMC first (right tissue). Markers visualized and their mass tags are labeled below images. MALDI-IHC step size was 20 µm. D Comparisons of two N-glycan ion images (1809.643 and 2174.763 m/z, 40 µm) from MALDI-MSI first and MALDI-IHC first along with (E) the whole spectra of N-glycans, (F) mean percent change when compared to MALDI-MSI first, and (G) the 10 most intense N-glycan peaks, ordered by MALDI-IHC first. H Images of collagen peptides with masses 843.394 m/z and 1034.572 m/z are compared for MALDI-MSI first and MALDI-IHC first. Step size of 40 µm was used. I The spectra of extracellular molecules are compared. J The percent difference in peak intensity displayed for a subset of selected peaks with respect to MALDI-MSI first. K Top 10 collagen peaks of highest intensity in MALDI-IHC first are compared

