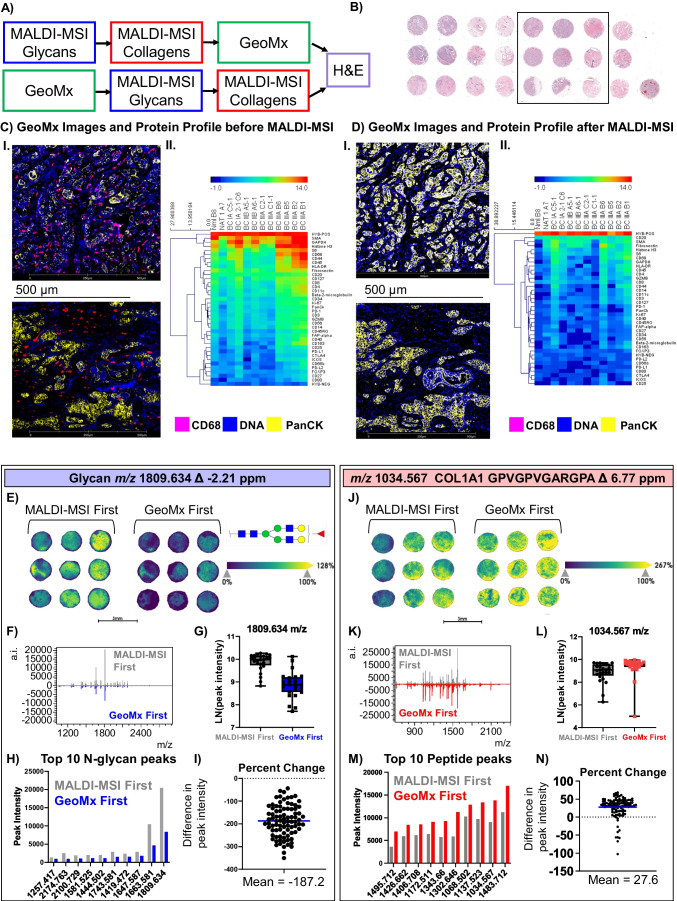
Fig. 2.
Combination of MALDI-MSI and GeoMx on human breast tissue microarray. A An overview of the workflows performed. B Representative H&E of the breast TMA. Boxed region signifies cores shown in E and J (C) I Two areas of illumination from two TMA cores imaged by GeoMx before MALDI-MSI and II the associated protein profiles from the 12 areas illuminated within the TMA. (D) I The same cores and areas of illumination are shown for the slide processed by GeoMx after MALDI-MSI and II the associated protein profiles displayed as a heatmap. In the fluorescence images, markers include DNA (blue), PanCK (yellow), and CD68 (pink) and the heatmaps profile cells segmented by positive PanCK status within an ROI. E Comparison of N-glycan ion images (1809.634 m/z) taken with 30-µm step size along with (F) the whole spectra of N-glycans and (G) quantitation of the 1809 m/z peak intensities visualized by individual patient. H The 10 most intense N-glycan peaks over the whole TMA are shown, ordered by GeoMx first. I The differences in peak intensities are highlighted by the percent change when comparing GeoMx first to MALDI-MSI first. J Peptide images for m/z 1034.572 with step size of 30 µm are compared for MALDI-MSI first and GeoMx first. K The spectra of extracellular molecules are compared and L peak intensities for m/z 1034.572 are visualized by individual patient. M The top 10 peaks of highest intensity in GeoMx first are compared. N The percent difference in peak intensity for a subset of selected peaks with respect to MALDI-MSI first shows that on average GeoMx first peaks had higher intensities than MALDI-MSI first

