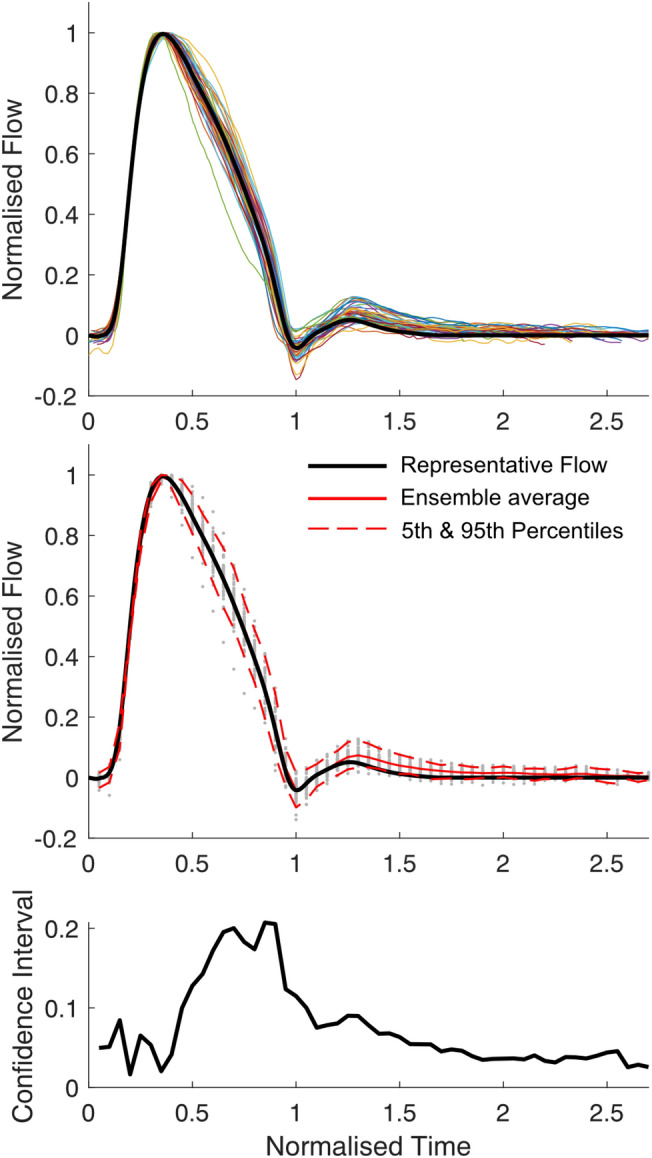
Fig. 2.

Average flow waveform for patients with normal cardiac function and aorta. (Top) Individual flow waveforms (coloured lines) and population-derived waveform (black line). (Middle) Population-derived representative waveform (black line), ensemble average flow waveform (solid red line, visible only during diastole, otherwise identical to black line), 5th and 95th percentiles (dashed red lines), with individual data points (grey dots) plotted at normalized time intervals of 0.05. (Bottom) Width of 5-95% confidence interval.
