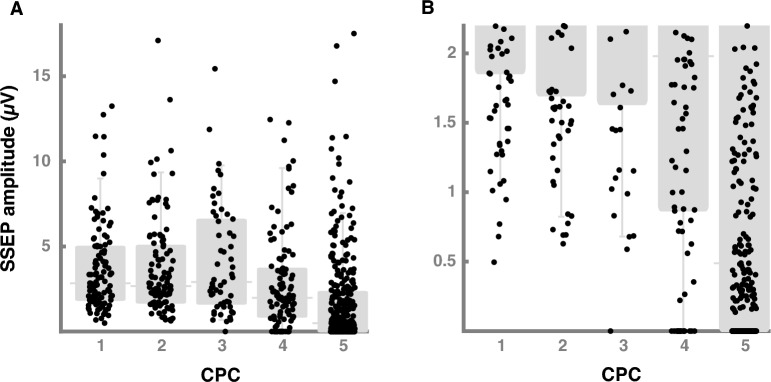
Fig. 1.
Cortical SSEP amplitudes and clinical outcome. A This figure shows the association between cortical SSEP amplitudes and clinical outcome assessed by CPC. We present the results as scatterplots (black dots) and box plots (gray) with inter-quartile range, median and whisker bars representing the 5th and 95th percentile. B The y-axis is restricted to the lower cortical SSEP amplitudes to show the lower threshold of CPC 1–3 patients. SSEP somatosensory evoked potential, CPC Cerebral performance category

