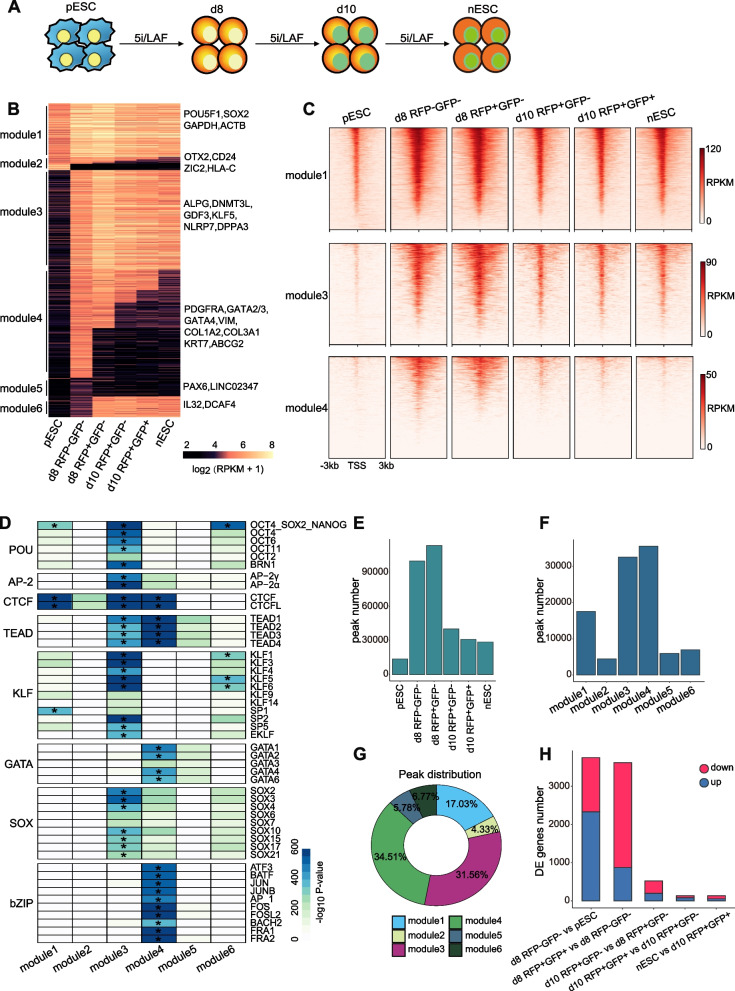
Fig. 1.
Chromatin accessibility dynamics during the primed-to-naive transition. A Schematic representation of the primed-to-naive transition using 5iLAF culture conditions. B Chromatin loci arranged into groups according to closed or open status during the putative consecutive stages towards naive pluripotency. Representative genes are noted for each module on the right side. C Heatmaps of ATAC-seq signals for module 1, 3, 4, respectively. The heatmaps are centered on the ATAC-seq peak (upstream 3 kb and downstream 3 kb of the peaks). D Motif discovery for each module shown in Fig. 1 B. *p < 10^ −300. E The number of peaks defined in each sample. F The number of peaks defined in each module. G Pie chart of the peak distribution for each module. H The number of differentially expressed genes between putative consecutive stages

