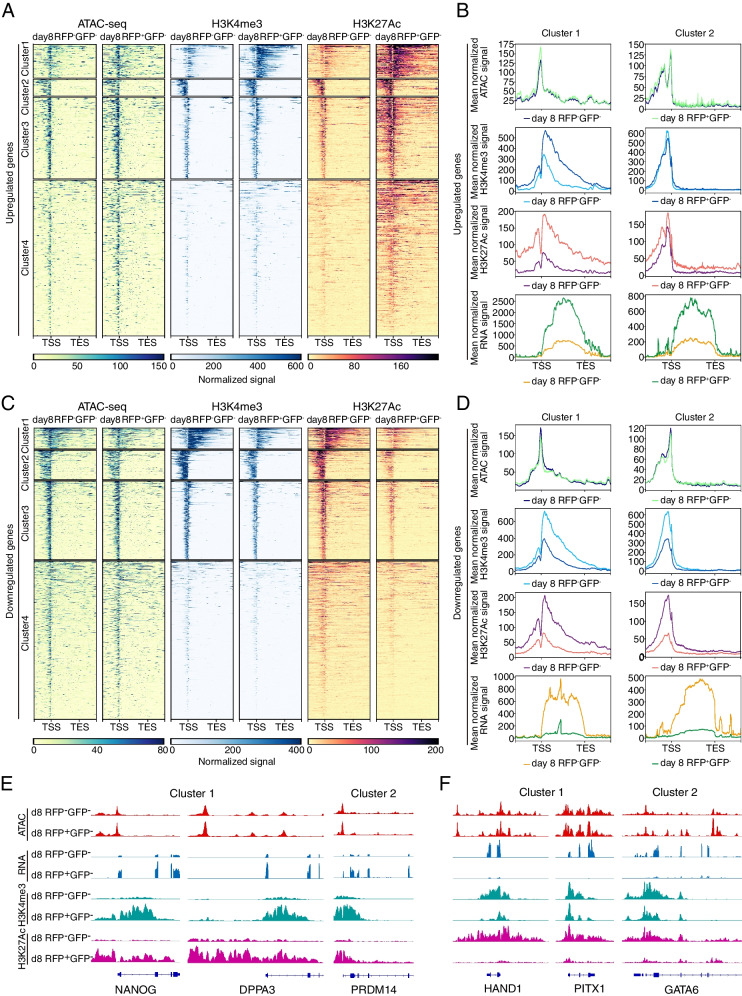
Fig. 3.
Histone modifications profiles of the discordant genes. A Heatmaps of ATAC signals (left), H3K4me3 signals (middle) and H3K27ac signals (right) for the discordant upregulated genes (upstream 3 kb and downstream 3 kb of the peaks). Loci were clustered by the k-means algorithm based on the signal profile and arranged by the average signal strength. B Pileups of mean ATAC signals (first panel), mean H3K4me3 signals (second panel), mean H3K27ac signals (third panel) and mean RNA signals (fourth panel) for the genes within cluster 1 and cluster 2 showed in Fig. 3 A (upstream 3 kb and downstream 3 kb of the peaks or transcripts with merged exons). C Heatmaps of ATAC signals (left), H3K4me3 signals (middle) and H3K27ac signals (right) for the discordant downregulated genes (upstream 3 kb and downstream 3 kb of the peaks). Loci were clustered by the k-means algorithm based on the signal profile and arranged by the average signal strength. D Pileups of mean ATAC signals (first panel), mean H3K4me3 signals (second panel), mean H3K27ac signals (third panel) and mean RNA signals (fourth panel) for the genes within cluster 1 and cluster 2 showed in Fig. 3C (upstream 3 kb and downstream 3 kb of the peaks or transcripts with merged exons). E ATAC signals (first panel), RNA signals (second panel), H3K4me3 signals (third panel) and H3K27ac signals (fourth panel) for the representative loci within cluster 1 and cluster 2 showed in Fig. 3A. F ATAC signals (first panel), RNA signals (second panel), H3K4me3 signals (third panel) and H3K27ac signals (fourth panel) for the representative loci within cluster 1 and cluster 2 showed in Fig. 3C

