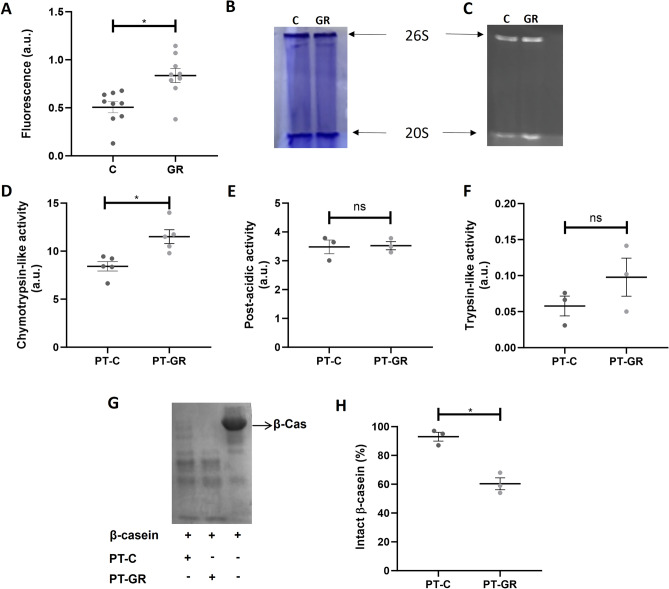
Figure 1.
Effect of glucose restriction on proteasome activity. (A) Proteasome activity in cellular extracts was assessed by incubating 50 µg of protein from control (C) or glucose restriction (GR) samples with 125 mM Suc-LLVY-AMC fluorogenic substrate as described in Methods. Each group represents nine independent assays ± standard deviation. *P < 0.05 significantly different from the control group; unpaired t test. a.u. = arbitrary units. (B–C) Proteins from cellular extracts obtained from cells grown under C or GR condition were separated by native electrophoresis as described in Methods. The gel was stained with Coomassie (B) and in-gel activity was assessed by spreading 100 µM Suc-LLVY-AMC onto the gel (C). (D–F) The peptidase activities of 20S proteasomes purified from C or GR cell extracts was evaluated by incubating 1 µg of isolated proteasomes with a fluorogenic substrate specific for each of the three catalytic sites of the proteasome: (D) 125 µM of Suc-LLVY-AMC for chymotrypsin-like activity, (E) 200 µM Z-LLE-AMC for post-acidic activity or (F) 200 µM Z-ARR-AMC for trypsin-like activity. Data represent 5 independent experiments for chymotrypsin-like activity and 3 independent experiments for trypsin-like and post-acidic activities ± standard deviation. * P < 0.05 significantly different from the control group; unpaired t test. (G) Proteolytic activity of proteasomes isolated from C or GR cells was assessed by incubating 5 µg of proteasomes with β-casein. Samples were submitted to electrophoretic separation in a 15% denaturing gel subsequently stained with Coomassie blue as described in Methods. (H) Quantification of intact β-casein. Each group represents 3 independent experiments ± standard deviation.

