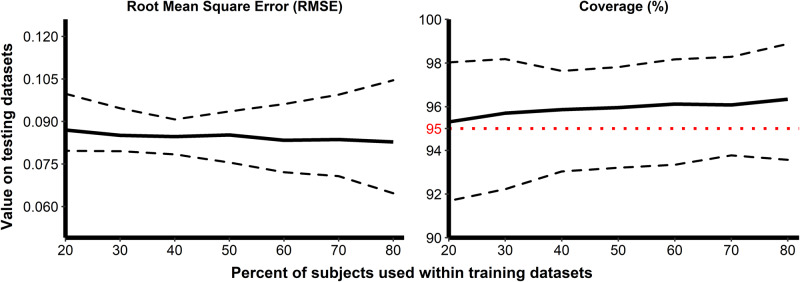
Fig. 6. Evaluation of the ability of the model to predict unseen data using Monte-Carlo cross-validation.
The predictive quality was assessed by the evaluation of two criteria: the RMSE (left side) and the percent coverage (right side). The x-axis corresponds to the percent of participants randomly selected for the training dataset and the y-axis to the value of criteria calculated on the testing dataset. One hundred replicates were performed for each train-test split percentage. Solid lines display the values of criteria and dashed lines, the 95% confidence intervals. The horizontal red dotted line on the right side displays the threshold of 95%.

