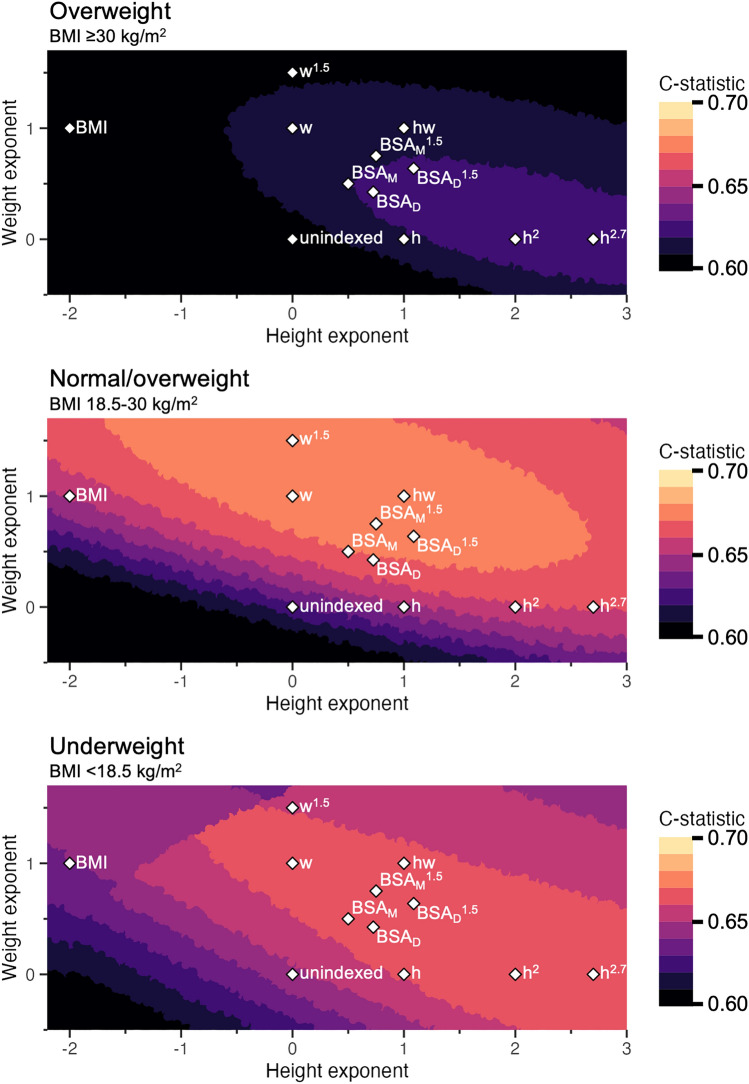
Figure 2.
Average prognostic strength (C-statistic) for predicting 5-year cardiovascular mortality when indexing for body size for right atrial area, left atrial volume, left ventricular diameter, left ventricular mass, and aortic sinus diameter. The axes represent the height and weight exponents of a body size indexation metric of the format heightx⋅weighty. The color scale shows the average C-statistic from 0.60 to 0.70, each color increment representing a 1%-point improvement. Existing body size metrics were plotted: h height, w weight, hw height⋅weight, BMI body mass index, BSA body surface area, M Mosteller, D DuBois. In the normal weight/overweight group, from unindexed to BSA by Mosteller there is a 4%-point improvement, but further improvement is limited to < 1%-point. Similar trends can be observed in the underweight and obese group. Echocardiographic measures with a limited number of observations were not included. See text for details.

