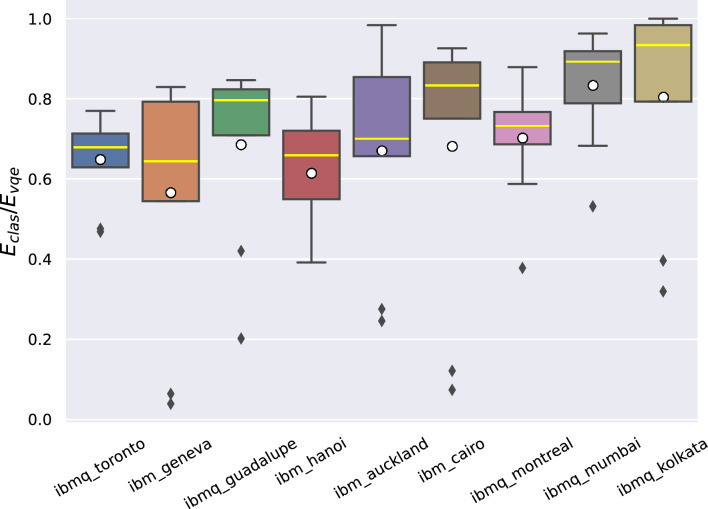
Figure 6.
Results of experiments run with the nine ansatz considered, on different real quantum devices, ordered according to growing quantum volumes. The box extends from the quartile to of the data, with a yellow line at the median (). The black lines extend from the edges of the box to show the range of the data. Here a standard approach is followed, as they extend to a maximum of from the edges of the box, ending at the farthest data point in the interval. Data outliers are plotted as black squares, while the white dots represent the mean of the result distribution for each hardware.

