
Fig. 3. Placental genomic risk for schizophrenia and adult intracranial volume (ICV) in cubic centimeters (cm3; n = 100).
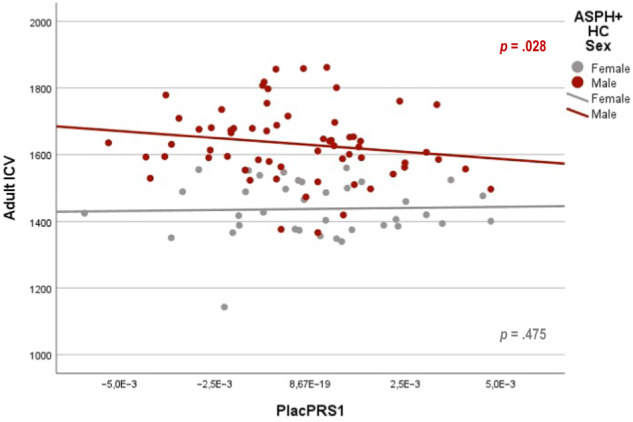
Scatterplot of the relationship of adult ICV with placental genomic risk scores for schizophrenia, constructed from alleles showing the most significant association with schizophrenia (GWAS p < 5 × 10⁻⁸; PlacPRS1) within loci containing genes highly expressed in placenta and differentially expressed in placentae from complicated compared with normal pregnancies. Scatterplot of the relationship of adult ICV with PlacPRS1 in control females with ASPH (n = 37; gray dots) and control males with ASPH (n = 63; red dots), with p-values in respective colors for each group. One-tailed p-values are reported in the figure, based on the directionality of the findings in previous study [20, 21]. See main text and Supplementary Table 7 for detailed statistics.