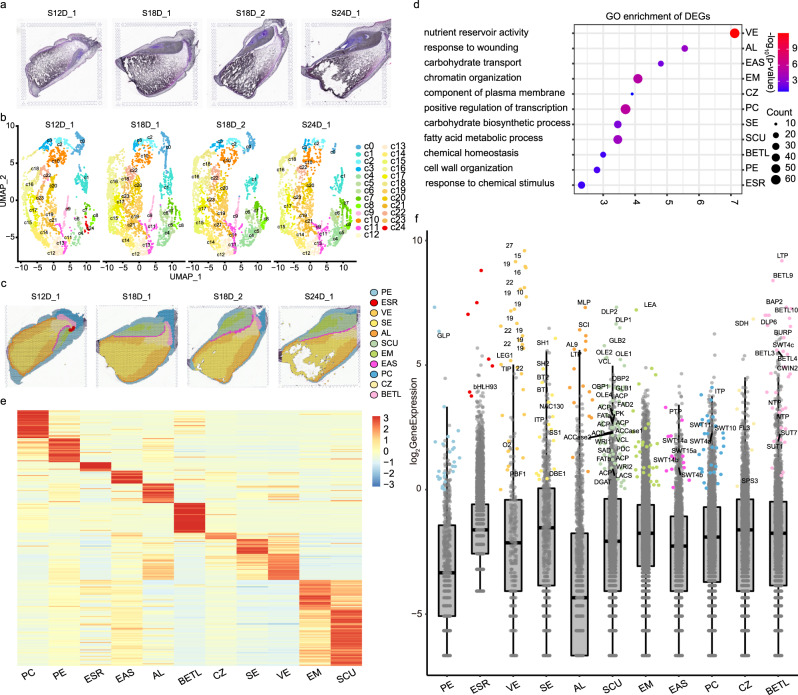
Fig. 1. Global spatiotemporal analysis of three filling stages.
a Histological structure of developing kernels at 12, 18 DAP, and 24 DAP. Side length = 6.5 mm. b Dimensional reduction and spot clustering. c Kernel compartment identification. d GO enrichment for differentially expressed genes. PC-GO:0045944, positive regulation of transcription by RNA polymerase II; PE-GO:0071554, cell wall organization or biogenesis; SCU- GO:0006631, fatty acid metabolic process; EM-GO:0006325, chromatin organization; BETL-GO:0048878, chemical homeostasis; AL-GO:0009611, response to wounding; EAS-GO:0008643, carbohydrate transport; CZ-GO:0046658, anchored component of membrane; SE-GO:0016051, carbohydrate biosynthetic process; VE-GO:0045735, nutrient reservoir activity; ESR-GO:0070887, cellular response to chemical stimulus. The enriched GO categories were determined using the one-sided version of Fisher’s exact test, followed by the Benjamin-Hochberg correction to obtain adjusted p values for multiple testing. e Heat map of scaled marker gene expression (UMI index). The color scale from blue to red represents the UMI index. f The marker gene expression level compared with non-marker genes. The marker genes are labeled with different colors according to compartments. Due to space limitations, only the genes involved in plant defense, seed development, sugar transport, starch, protein, and lipid accumulation are labeled. The non-marker genes are colored in gray dots. The box in the boxplot represents the middle 50% of the data, which is equivalent to the interquartile range (IQR, the difference between the 25th percentile and the 75th percentile) The median value, which is the second quartile, is positioned in the middle, dividing the data into two halves. Each whisker extends to the farthest data point within 1.5 times the IQR in each direction. The lower end of the dark line represents the minimum gene expression, while the upper end represents the maximum gene expression. Abbreviation is provided in Supplementary Data 4. S12D_1 indicates the sample taken at 12 DAP; S18D_1 indicates the sample taken at 18 DAP; S18D_2 indicates the biological sample taken at 18 DAP; S24D_1 indicates the sample taken at 24 DAP. Source data are provided as a Source Data file.

