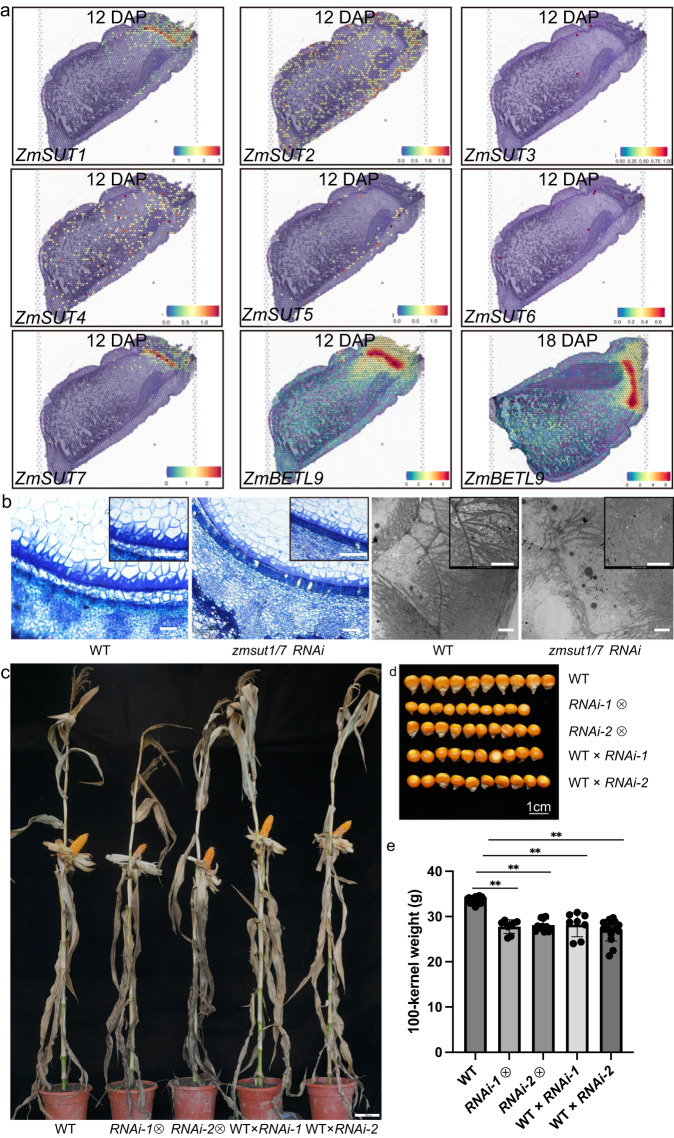
Fig. 4. Functional study of ZmSUT genes in maize seed.
a Spatial expression patterns of ZmSUT (14 DAP) and Betl9 (14 and 18 DAP) genes. b Semi-thin sections (panels 1 and 2) and transmission electron microscopy (TEM, panels 3 and 4) of the BETL region in the wild-type KN5585 (panels 1 and 3) and zmsutRNAi-1/7 (panels 2 and 4) seeds at 14 DAP. The experiment was independently repeated three times. In panels 1 and 2, bars = 100 μm; in panels 3 and 4, bars = 5 μm. c Plant phenotypes of the wild-type KN5585, selfing zmsut1/7RNAi-1, selfing zmsut1/7RNAi-2, WT × RNAi-1 and WT × RNAi-2. Bar = 10 cm. d Kernel phenotypes of the wild-type KN5585, selfing RNAi-1, selfing RNAi-2, WT × RNAi-1 and WT × RNAi-2. Bar = 1 cm. e 100-kernel weight of the wild-type KN5585, selfing RNAi-1, selfing RNAi-2, WT × RNAi-1 and WT × RNAi-2. A one-way ANOVA revealed that there was a statistically significant difference among the different genetic background between at least two groups (F(between groups df = 4, within groups df = 60) = 44.89, P = 2.15e-17). The further Tukey’s HSD Test for multiple comparisons found that the mean value of 100-kernel weight was significantly different between the mutants and the wild type (**P < 0.001). The details are: selfing RNAi-1 (means ± SD = 27.77 ± 1.50, P = 3.58289E-15, n = 8), selfing RNAi-2 (means ± SD = 28.12 ± 1.34, P = 3.90318E-17, n = 12), WT×RNAi-1 (means ± SD = 28.21 ± 2.65, P = 6.41384E-10, n = 8), WT×RNAi-2 (means ± SD = 27.00 ± 2.43, P = 3.02368E-14, n = 15), and WT (means ± SD = 33.62 ± 0.62, n = 22). Data are presented as means ± SD. n indicates the number of biologically independent samples. There was no statistically significant difference within mutant groups (P = 0.45–0.99). Source data are provided as a Source Data file.

