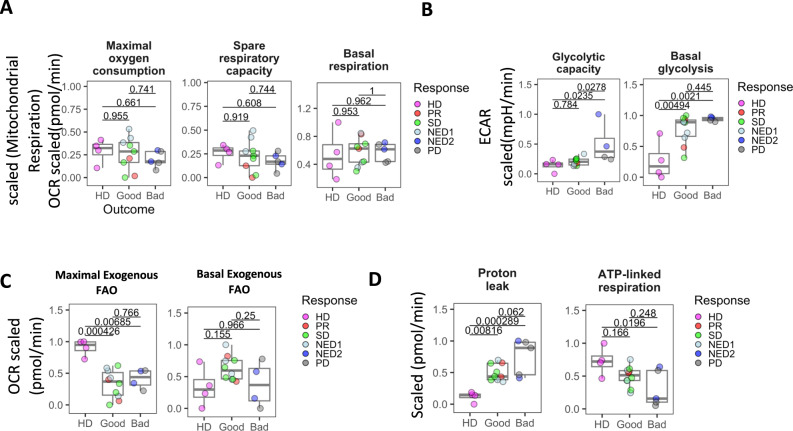
Fig. 2. Seahorse metabolic profiling HD and melanoma patient-derived mDC.
Box plots represent distribution of Seahorse metabolic measurements in mDCs stratified by clinical outcome. A Scaled values for oxygen consumption rate (OCR) parameters for maximal oxygen consumption rate, spare respiratory capacity and basal respiration, B glycolytic capacity and basal glycolysis derived from extracellular acidification rate (ECAR) measurements, C OCR-derived exogenous fatty acid oxidation and D proton leak and ATP-linked respiration changes are shown for mDCs from heathy donor (HD, n = 4), good (PR/SD/NED1, n = 9) and bad (PD/NED2, n = 6) outcome groups. Box plots indicate 1st, 2nd and 3rd quartile; whiskers indicate minimum and maximum. Multi-group comparisons were tested by one-way ANOVA with Tukey’s post-hoc test. Source data are provided as a Source Data file.

