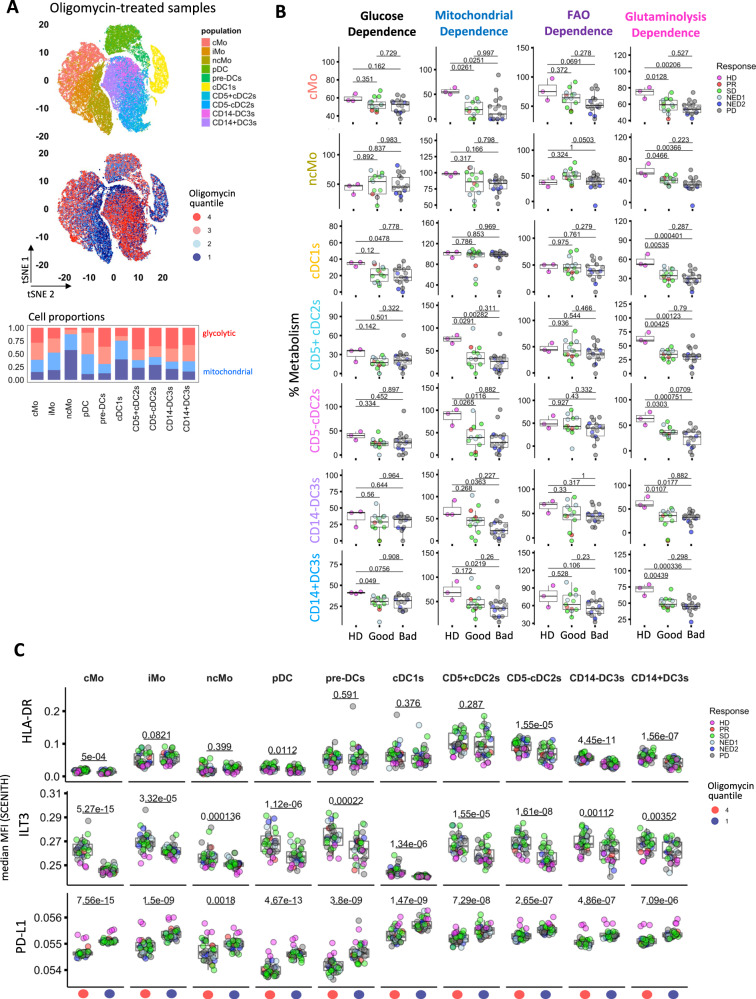
Fig. 8. Profiling the effects of metabolic states on immune phenotypes of circulating monocyte/myeloid and DC populations in HD and melanoma patients.
A T-distributed stochastic neighbor embedding (tSNE) based on lineage/inflammatory markers (indicated in Supplementary Table 3) was used to visualize multidimensional separation of Oligomycin-treated circulating myeloid/DC subtype populations from HD and melanoma patients. B Box plots represent differences in SCENITH metabolic parameters in circulating myeloid/DC subtypes between heathy donor (HD, n = 3) vs. good (PR/NED1/SD, n = 13) and bad (PD/NED2, n = 17) response groups. Pairwise comparisons against a HD reference group in were calculated using Two-tailed Student’s t-test with Holm-Bonferroni correction. C Box plots represent comparisons of median MFI expression profiles for circulating myeloid/DC subtype populations between glycolytic (red) and mitochondrial-dependent (blue) oligomycin quantiles (n = 30). In B, C Box plots indicate 1st, 2nd and 3rd quartile; whiskers indicate minimum and maximum. Statistical significance between outcome groups was determined using Two-tailed Student’s t-tests. Source data are provided as a Source Data file.

