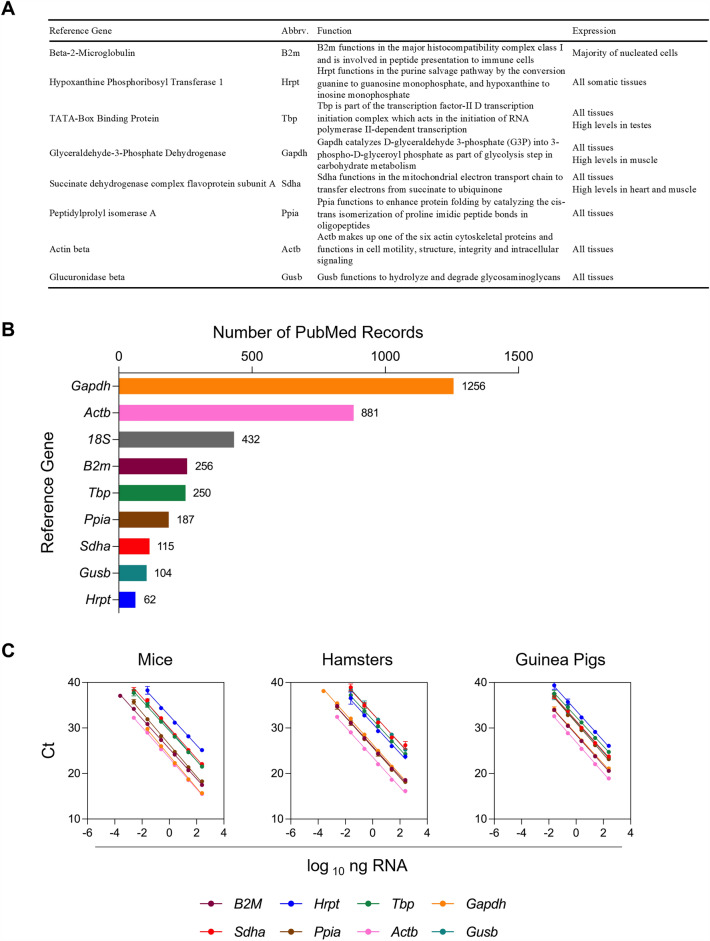
Figure 2.
Reference gene targets chosen for gene stability investigation to use in RT-qPCR normalization. (A) Reference gene function and expression. Data were collated from the GeneCards Suite18 and the Mouse Genome Informatics Gene Expression Database19. (B) Number of results obtained from PubMed queries including the common names and abbreviations for each specifc RG (e.g., “18S” or “18SRNA” or “18S RNA”) and “housekeeping gene” or “reference gene.” (C) Standard curves were generated by making tenfold dilutions of 100 ng/µL total RNA isolated from the spleen of naïve mice, hamsters, or guinea pigs. Each point represents the mean of 8 independent RT-qPCR reactions, and error bars indicate the standard deviation from the mean.

