FIGURE 2.
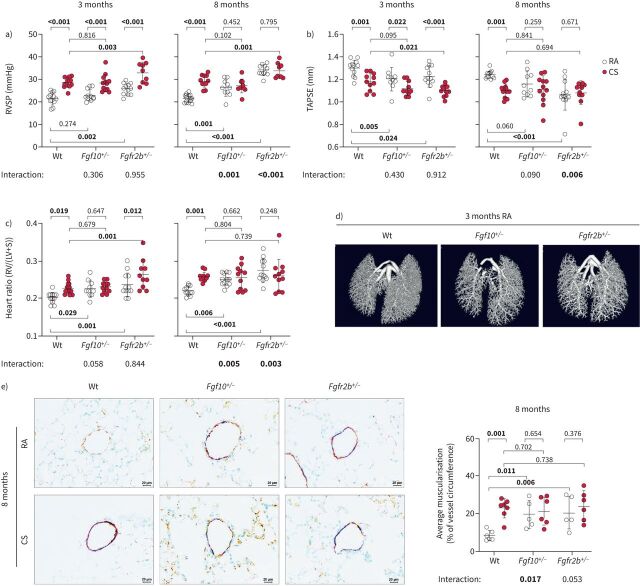
Mice with impaired fibroblast growth factor (FGF)10 signalling spontaneously develop pulmonary hypertension. Pulmonary hypertension assessed by measurement of a) right ventricular systolic pressure (RVSP) (n=9–12) and b) echocardiographic tricuspid annular plane systolic excursion (TAPSE) quantification (n=10–12). c) Right ventricular (RV) hypertrophy quantified by the weight ratio between the RV and left ventricle with septum (LV+S) (n=10–12). No significant changes in LV+S mass were detected between analysed groups. d) Pulmonary vasculature visualised ex vivo by microcomputed tomography in lungs perfused with radio-dense Microfil, representative scans of lungs from wild-type (Wt), Fgf10+/− or Fgfr2b+/− mice exposed to room air (RA) for 3 months. e) Representative images of pulmonary vessels (brown: von Willebrand factor; purple: α-smooth muscle actin; green: nuclei) and quantification of average vessel muscularisation in lungs of experimental animals (n=5–7). Analysis was performed in pulmonary vessels with a diameter of 20–70 µm and results are shown as percentage of vessel circumference positive for α-smooth muscle actin staining. In the quantification panels each dot represents a measurement obtained from one individual experimental animal. The mean value for each group is represented by a horizontal line (±sd). Statistical analysis: two-way ANOVA; p-values for each comparison and interaction are given in the graphs. CS: cigarette smoke. Bold type represents statistical significance.

