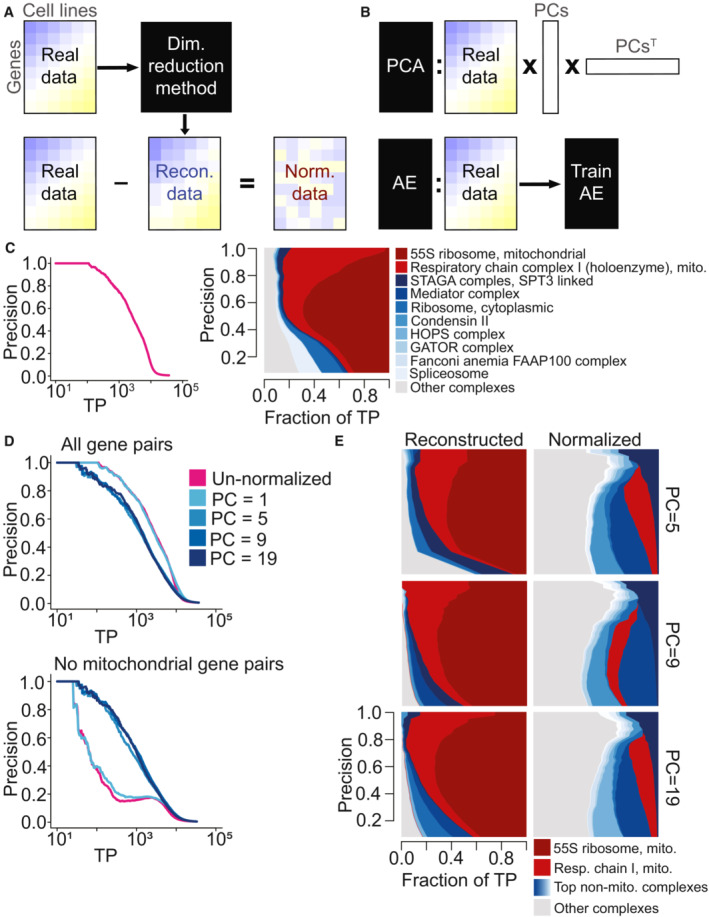
Figure 1. Normalization schematic and exploration of mitochondrial bias within the DepMap with Principal Component Analysis (PCA) normalization.

-
AA dimensionality reduction method is applied to the original DepMap data to extract a low‐dimensional representation of the data. Reconstructed data are generated from that, which is subtracted from the original DepMap to normalize it.
-
B(Top) Principal Component Analysis (PCA) generates reconstructed DepMap data by multiplying the DepMap against selected Principal Components (PC) derived from it and the transpose of those PCs. (Bottom) Autoencoders generate reconstructed data post‐training by passing in the original DepMap as input.
-
C(Left) Precision‐recall (PR) performance analysis of original DepMap 20Q2 data (Data ref: Broad DepMap, 2020) evaluated against CORUM protein complexes. The x‐axis depicts the absolute number of true positives (TPs) recovered in log scale. (Right) Contribution diversity plot of CORUM complexes in un‐normalized DepMap data. This plot is constructed by sliding a precision cutoff from high to low (indicated by the y‐axis), and at each point, plotting a stacked bar plot across the x‐axis at that point reflecting the breakdown of complex membership of the TP pairs identified at that threshold. The top 10 contributing complexes are listed in the legend, with the light gray category representing all complexes represented at lower frequency.
-
D(Top) Precision‐recall (PR) performance analysis of PCA‐normalized DepMap data with the first 5, 9, and 19 principal components removed evaluated against CORUM protein complexes. (Bottom) PR performance with mitochondrial gene pairs removed from evaluation. The x‐axis of both plots depicts the absolute number of true positives (TPs) recovered in log scale.
-
EThe contribution diversity plots depict contributions of TP pairs from various CORUM complexes in PCA‐reconstructed data and PCA‐normalized data generated by removing the first 5, 9, and 19 principal components.
