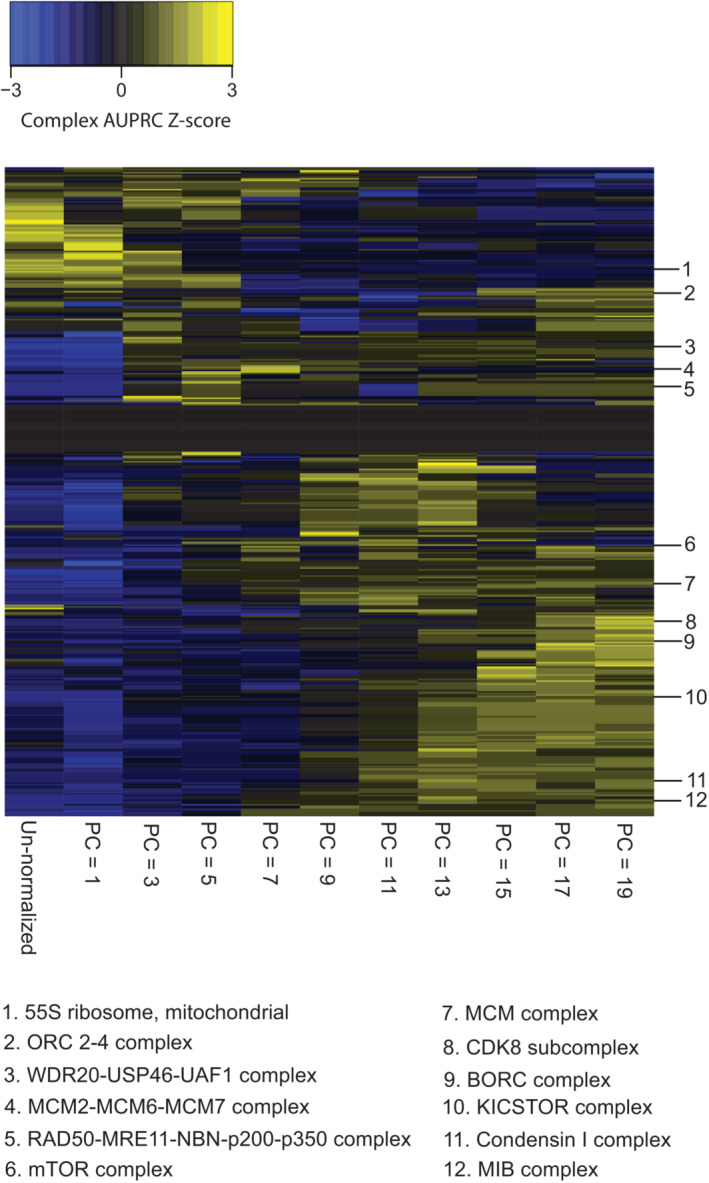
Figure EV1. CORUM complex z‐scores of AUPRC values for PCA normalization.

AUPRC values per complex (rows) for the un‐normalized DepMap 20Q2 data (Data ref: Broad DepMap, 2020) (far left column) are compared to PCA‐normalized DepMap data with the first 1, 3, 5, 7, 9, 11, 13, 15, 17, or 19 PCs removed. AUPRC values have been z‐score‐normalized per row for visualization purposes.
