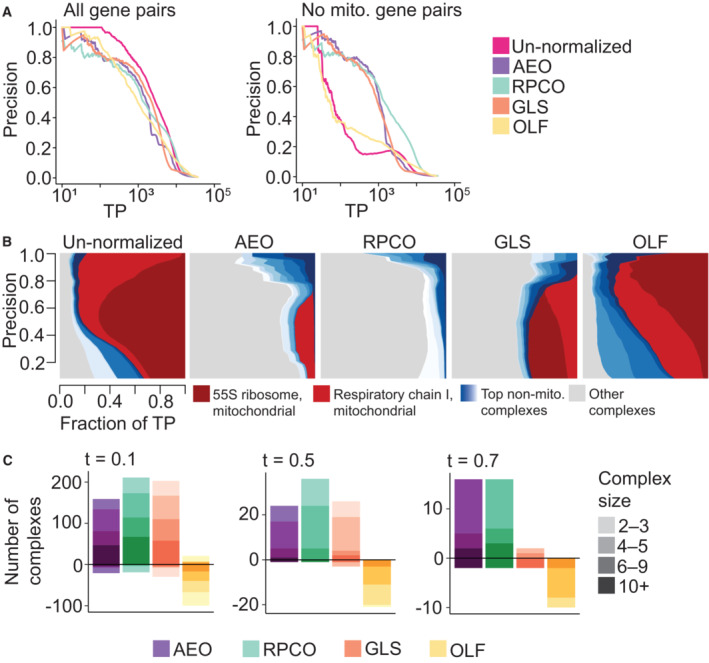
Figure 4. Benchmarking onion normalization against other methods.

- FLEX precision‐recall (PR) performance analysis of original DepMap 20Q2 data (Data ref: Broad DepMap, 2020) and data from onion normalization with autoencoders (AEO), onion normalization with robust PCA (RPCO), generalized least squares (GLS) normalization from Wainberg et al (2021), and olfactory receptor (OLF) normalization from Boyle et al (2018) against CORUM protein complexes as the standard. (Left) All CORUM co‐complex gene pairs as true positives. (Right) Mitochondrial gene pairs are removed from the evaluation. The x‐axis of both plots depicts the absolute number of true positives (TPs) recovered in log scale.
- Contribution diversity of CORUM complexes for the original DepMap, AEO, RPCO, GLS, and OLF data. Fractions of true positives (TP) from different complexes are plotted at various precision levels on the y‐axis. Note that the left panel is replicated from Fig 1C (right panel) and 3C, and the second and third panels are replicated from Fig 3C.
- Number of complexes for which area under the PR curve (AUPRC) values increase and decrease with respect to chosen AUPRC thresholds due to normalization as compared to un‐normalized data for AEO, RPCO, GLS, and OLF data. The color gradient for each method represents four bins with complexes containing 2–3 genes, 4–5 genes, 6–9 genes, and 10 or more genes. (Left) t = 0.1. (Middle) t = 0.5. (Right) t = 0.7.
